
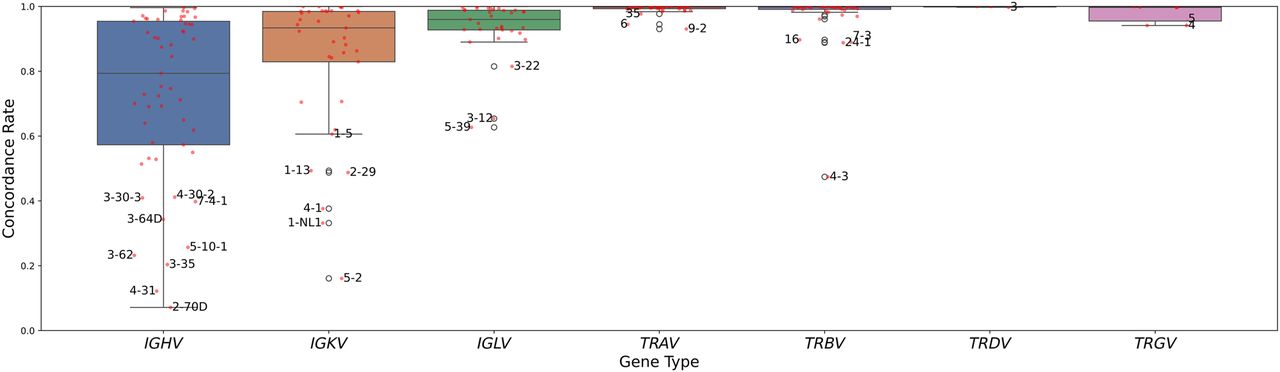
Figure 2.
Mean gene-level concordance distribution across all trios, stratified by locus type, in which each point represents a particular gene. Genes with mean concordance rates of one or more SD from the mean are labeled.
(Downloading may take up to 30 seconds. If the slide opens in your browser, select File -> Save As to save it.)
Click on image to view larger version.
Mean gene-level concordance distribution across all trios, stratified by locus type, in which each point represents a particular gene. Genes with mean concordance rates of one or more SD from the mean are labeled.
 CiteULike
 Delicious
 Digg
Digg Facebook
 Google+
 Reddit
 Twitter
