
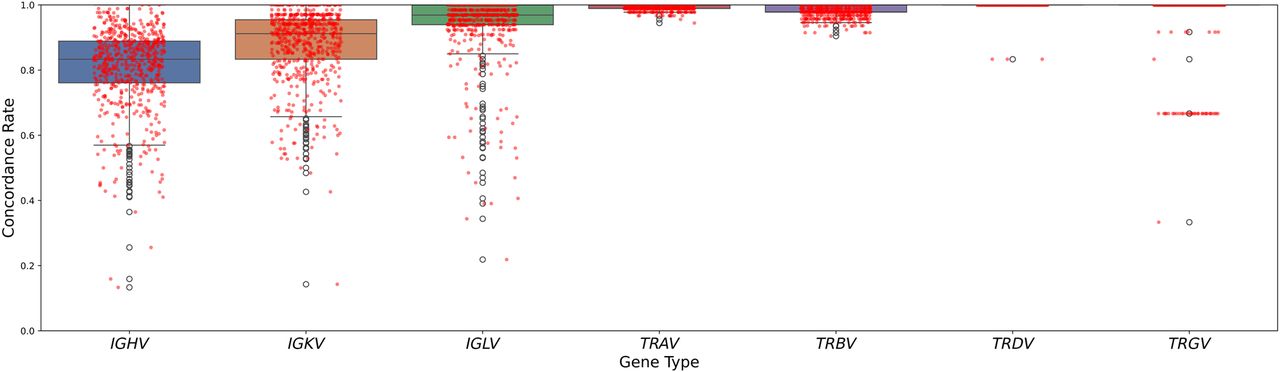
Figure 1.
Distribution of Mendelian concordance rates for functional variable gene rates across immune loci. Box plots show the median, quartiles, and outliers for each locus type. Note the distinct clustering of trio concordance in TRGV is because that locus has only six genes; for example, a single two-copy gene discordance causes a concordance value of 5/6.


