
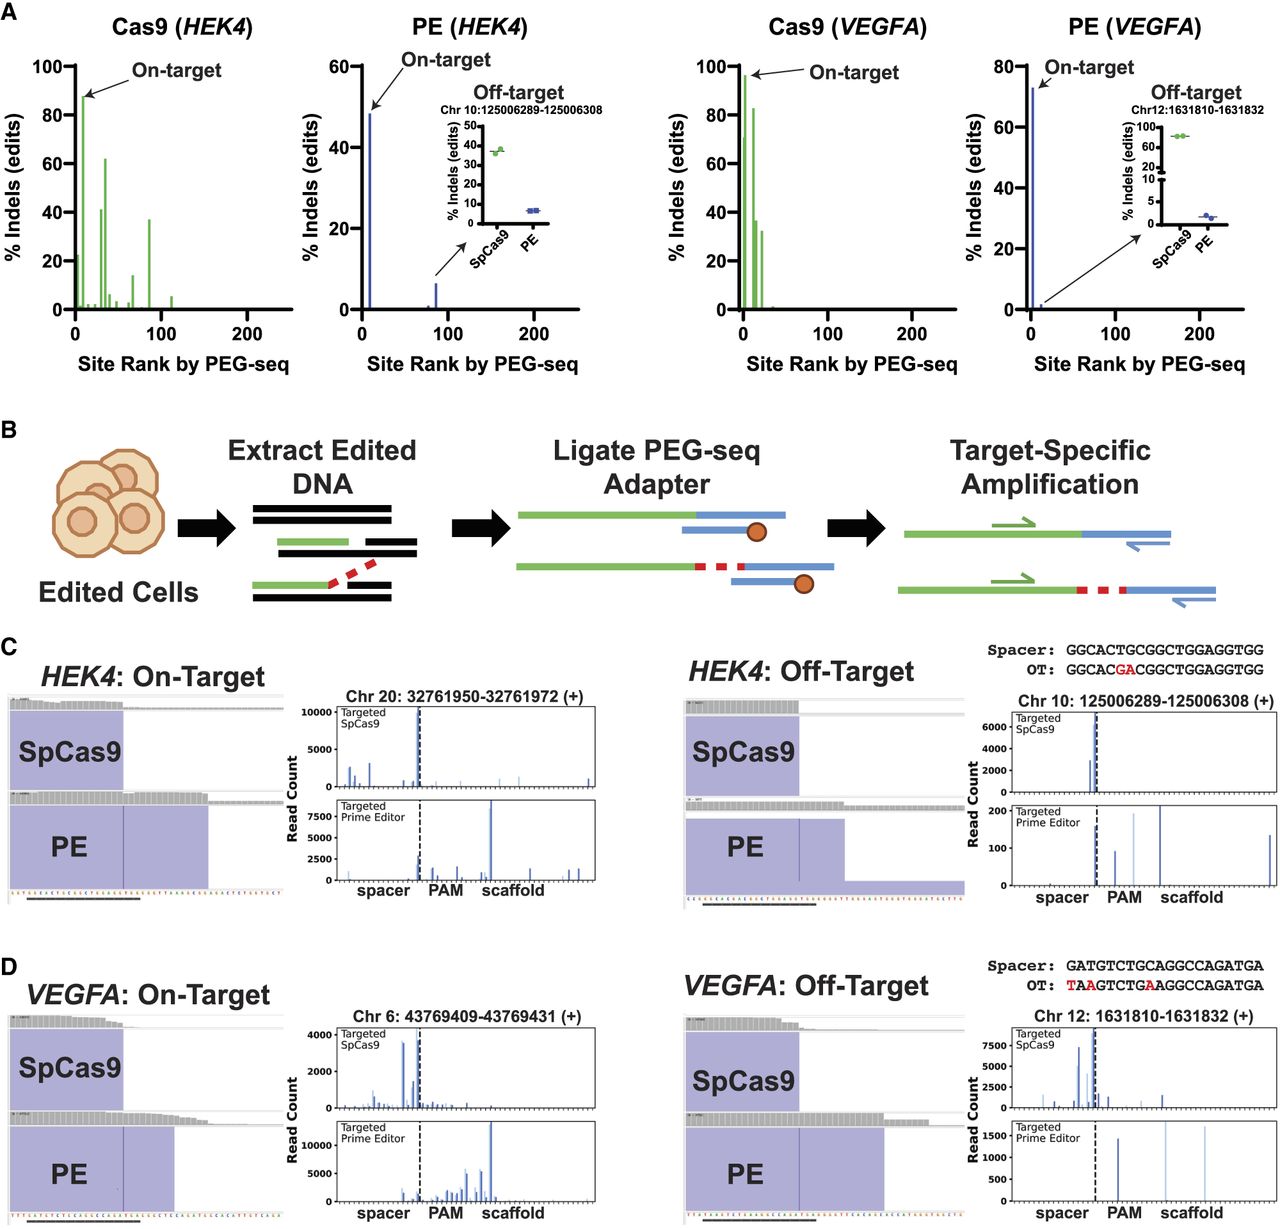
Analysis of PEG-seq identified off-targets in edited cells for SpCas9, and prime editor validates the ability of PEG-seq to identify editing sites in cells and shows RT extension at the on-target and infrequently at the identified off-target sites. (A) Hybrid capture analysis of SpCas9 and PE edited cells for the HEK4 (left) and VEGFA (right) pegRNAs. The top 250 sites identified by PEG-seq were analyzed, and the indel rate minus mock edited sample is shown averaged across two replicates. Each on-target is identified, and the prime editor off-target is shown in the inset plot (N = 2). (B) Overview of the targeted PEG-seq method used to analyze in cellulo generated DNA nicks and flaps at each corresponding on- and off-target site. (C,D) For each on- and off-target site, a representative IGV plot displays the mapped sequencing reads (purple blocks) and the read coverage at each position (gray bars) for prime editor and SpCas9 samples. (C,D) A PEG-seq signal plot is included with each IGV plot to display the count of reads that start at a given position. In all samples, the SpCas9 signal is apparent with a strong accumulation at the predicted nick site or 1–5 bp 5′ to that site (nick site is indicated by a broken line). A “scaffold” region is included to depict reads demonstrating RTT extension (seen as an accumulation of read start sites 3′ to the predicted nick location) that would not align to the reference sequence. The PE signal, including RTT extension, is apparent as the dominant signal at each on-target site (left) and is measurable, albeit at low frequency, in the off-target sites (right).


