
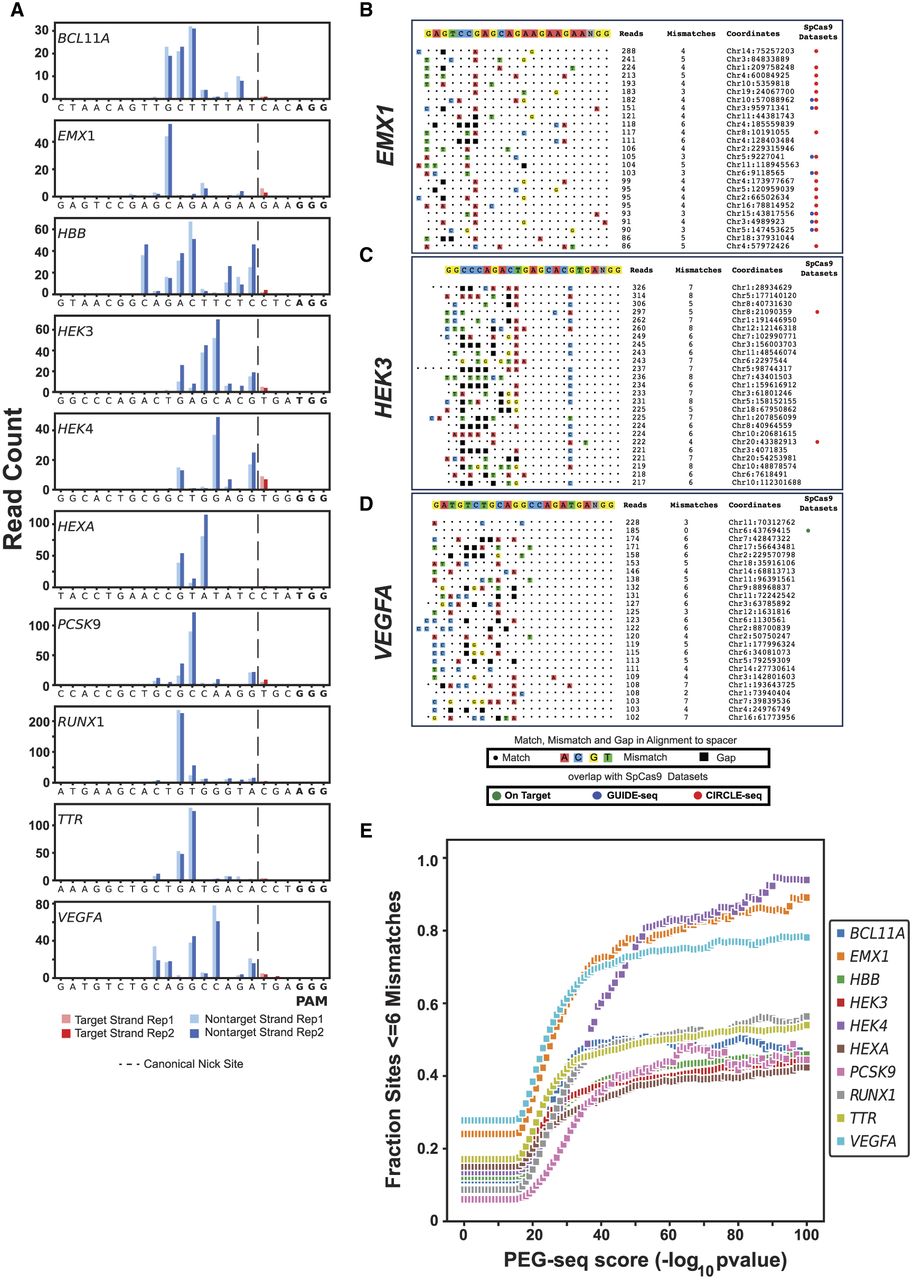
PEG-seq detects off-target sites for a variety of spacer sequences. (A) Distribution of reads at the on-target for each of the indicated spacer sequences. Note that although the majority of signal comes from the nontarget strand (blue), a small amount of signal is observed on the target strand (red) for some spacers (e.g., HEK4). Data from replicate experiments are plotted for each site indicated by bar shading. (B–D) Sorted list of top 25 highest signal peaks in PEG-seq data for EMX1 (B), HEK3 (C), and VEGFA (D). For each site, the alignment to the spacer sequence is indicated with any mismatches (colored boxes) or gaps (black boxes), average read number, genomic location, and overlap with SpCas9 off-target data sets for CIRCLE- or GUIDE-seq shown for each potential off-target site. (E) Plot of the fraction of sites identified by PEG-seq at each score threshold that are within six mismatches or gaps of the indicated spacer sequence.


