
Abstract
The spatial heterogeneity of gene expression has driven the development of diverse spatial transcriptomics technologies. Here, we present photocleavage and ligation sequencing (PCL-seq), a spatial indexing method utilizing a light-controlled DNA labeling strategy applied to tissue sections. PCL-seq employs photocleavable oligonucleotides and ligation adapters to construct transcriptional profiles of specific regions of interest (ROIs) designated via microscopically controlled photo-illumination. In frozen mouse embryos, PCL-seq generates spatially aligned gene expression matrices and produces high-quality data, detecting approximately 170,000 unique molecular identifiers (UMIs) and 8600 genes (illumination diameter = 100 µm). Moreover, PCL-seq is compatible with formalin-fixed paraffin-embedded (FFPE) tissues, successfully identifying thousands of differentially enriched transcripts in the digits and vertebrae of mouse embryo FFPE sections. Additionally, PCL-seq achieves subcellular resolution, as demonstrated by differential expression profiling between nuclear and cytoplasmic compartments. These characteristics establish PCL-seq as an accessible and versatile workflow for spatial transcriptomic analyses in both frozen and FFPE tissues with subcellular resolution.
With the advancement of single-cell sequencing technologies, it has become evident that spatial regulation of gene expression is critical for the proper functioning of biological systems (Delile et al. 2019; Hildebrandt et al. 2021; Chen et al. 2022; Hwang et al. 2022; Tavares-Ferreira et al. 2022; Wang et al. 2023). Consequently, analyzing the spatial environment is essential for uncovering deeper biological insights. Spatial transcriptomics, when integrated with conventional single-cell sequencing, in situ techniques, and other omics platforms, enables the study of gene expression within spatial contexts at single-cell and ultrahigh resolution. This integration opens new research opportunities in cancer, immunology, neurology, and developmental biology (Moncada et al. 2020; van den Brink et al. 2020; Melo Ferreira et al. 2021; Liu et al. 2023; Shiau et al. 2023).
Existing spatial transcriptomics approaches can be broadly classified into two categories. The first involves analyzing gene expression across entire tissue sections using either gene-specific in situ hybridization (ISH) probe pools (Rahman and Zenklusen 2013; Chen et al. 2015; Shah et al. 2016; Eng et al. 2019) or in situ mRNA capture (Ståhl et al. 2016; Rodriques et al. 2019; Vickovic et al. 2019; Srivatsan et al. 2021; Stickels et al. 2021; Chen et al. 2022; Russell et al. 2024). The second category targets specific regions of interest (ROIs) with known locations or morphologies, facilitating a more directed analysis (Moses and Pachter 2022). Compared with whole-transcriptome methods, focusing on specific ROIs is often more practical, cost-effective, and clinically relevant, particularly when studying tissue heterogeneity (Genshaft et al. 2021).
ROIs can be defined by physical or optical marking. Physical isolation techniques like LCM-seq (Nichterwitz et al. 2016) rely on laser-based cutting of cells or small tissue regions, followed by RNA-seq. However, these approaches require sophisticated equipment, limiting their accessibility, and lack the ability to achieve subcellular resolution. In contrast, optical marking techniques utilize photosensitive compounds that undergo molecular changes upon light exposure, enabling the separation of illuminated versus unilluminated tissue regions for downstream analysis. These methods eliminate the need for costly instruments like laser confocal microscopes. Commercial platforms like GeoMx Digital Spatial Profiling (DSP) (Merritt et al. 2020) leverage UV-sensitive linkers that release oligonucleotides encoding protein and mRNA abundance data upon exposure to light. These oligonucleotides are captured, sequenced, and used to extract spatially resolved expression profiles. Although DSP can simultaneously analyze more than 180 proteins and 18,000 genes, its reliance on probes specific to the human or mouse transcriptome limits its use for other species. Alternative techniques, such as ZipSeq (Hu et al. 2020), PIC (Honda et al. 2021), and Light-seq (Kishi et al. 2022), use different photosensitive molecules to analyze ROIs. However, the 6-nitropiperonyloxymethyl (NPOM) compounds employed by ZipSeq and PIC are costly, whereas the 3-cyanovinylcarbazole nucleoside (CNVK) used in Light-seq has yet to achieve commercial availability, reducing the general applicability of these methods.
Here, we introduce a spatial transcriptomics method termed photocleavage and ligation sequencing (PCL-seq), which uses photocleavable (PC) linker compounds as photosensitive groups to capture gene expression profiles from arbitrary ROIs in tissue sections. PCL-seq offers a more cost-effective and adaptable approach. We demonstrate its compatibility with both conventional fresh-frozen tissue sections and FFPE sections of mouse embryos. Moreover, PCL-seq achieves subcellular resolution, enabling the profiling of gene expression in distinct subcellular compartments.
Results
PCL-seq overview
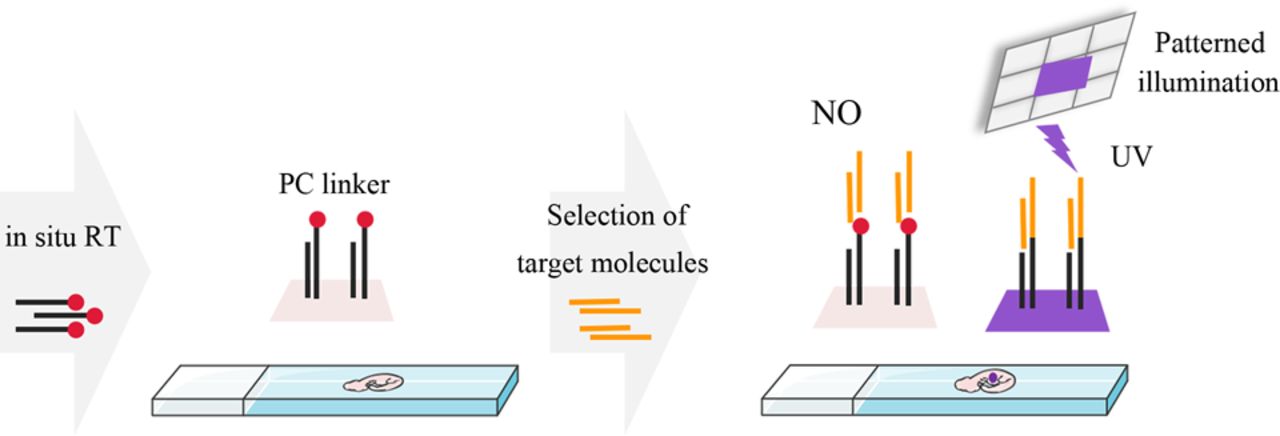
PCL-seq utilizes a light-controlled DNA attachment strategy to custom index arbitrary regions of interest within tissue sections. To achieve this, a poly(T) reverse transcription (RT) primer with a photocleavable linker at the 5′ end was used to convert mRNAs from fixed tissue samples into 5′-labeled cDNAs in situ. Under 365-nm UV exposure, PC linkers in target regions were selectively cleaved (Olejnik et al. 1998; Merritt et al. 2020), exposing a 5′-phosphate group, which enabled the ligation of adapters to the 5′ ends of cDNA via DNA ligase. In nonilluminated areas, the PC linker blocked adapter ligation, ensuring that only cDNA from illuminated regions was amplified and identified with high-throughput sequencing (Fig. 1).
Schematic of the light-controlled DNA attachment strategy. Frozen tissue sections adhered to poly-L-lysine slides are fixed and permeabilized. An in situ RT reaction using PC linker-modified RT primers is performed to synthesize “locked” cDNA. UV light, guided by Mosaic's system, is selectively directed onto the tissue sections to illuminate specific ROIs. In the illuminated regions, the PC linkers on the newly synthesized cDNA are cleaved, allowing the subsequent ligation of adapters. This enables the cDNA in the illuminated regions to be specifically amplified using primers complementary to the adapters, resulting in the construction of ROI-specific transcription libraries. In contrast, PC linkers in the nonilluminated regions remain intact, preventing adapter ligation and inhibiting the amplification of cDNA from these areas.
The core challenge of PCL-seq lies in achieving specific amplification of cDNA from illuminated regions. To address this, we implemented several optimizations. First, we employed the Andor Mosaic system, a digital mirror device (DMD)-based platform, to project computer-generated illumination patterns with a resolution of 2 µm (using a 20× objective, NA = 0.75). Photo-dissection experiments on functionalized slides were conducted to optimize light intensity and exposure time. Amino-modified RT-PC linker-FAM primers were covalently immobilized on CodeLink Activated slides (Wu and Grainger 2004; Ståhl et al. 2016). These slides were exposed to varying light intensities (10%, 40%, 70%, and 100% power) and durations (10, 20, and 30 sec) (Supplemental Fig. 1A–C). The final condition selected was 10 sec at 100% intensity, as it achieved efficient PC linker cleavage in illuminated regions while maintaining sharp boundaries. This was confirmed by fluorescence signal loss in the illuminated areas.
Second, during the in situ tissue reactions phase of PCL-seq, the PC linker on RT primers did not inhibit hybridization between complementary strands. However, in nonilluminated regions, hybridized sequences could act as “bridges,” leading to unintended signal amplification during later steps. To mitigate this, we performed high-concentration formamide washes to eliminate hybridization products between partially double-stranded sequences and cDNA in nonilluminated regions, reducing background noise. Fluorescent oligonucleotides were used to simulate this reaction, incorporating sequential illumination, adapter ligation, and high-concentration formamide washes. Fluorescence microscopy confirmed that this approach effectively eliminated unwanted signal amplification (Supplemental Fig. 1D). To further validate the importance of stringent washing conditions, we cultured HEK293 (human) and NIH/3T3 (mouse) cells on adjacent regions of a slide and selectively illuminated the NIH/3T3 area. After adapter hybridization and ligation, we either performed high-concentration formamide washes or skipped them. Subsequently, the sample was processed for PCL-seq library construction. Without formamide washes, human genic reads constituted 8.2% ± 0.007% (mean ± SD, n = 3 replicates) of total reads, whereas with formamide washes, this value decreased significantly to 0.4% ± 0.003% (mean ± SD, n = 3 replicates) (Supplemental Fig. 1E). These results demonstrate that combining optimized illumination conditions with formamide washes ensures precise and specific labeling of molecules in illuminated regions.
Establishment of PCL-seq for ROI-specific expression profiling
With these optimizations, we developed PCL-seq for spatial transcriptome analysis. Experimentally, the process began with RT primers modified with PC linkers to perform in situ reverse transcription on fixed and permeabilized tissue sections, synthesizing first-strand cDNA. Using the Mosaic companion software, we visualized and selected the ROI, subsequently irradiating the designated areas with UV light. Within the ROI, UV illumination caused the PC linker to detach from the RT primer, leaving a 5′ phosphate group on cDNA that facilitates ligation of a partially double-stranded (with its top strand, i.e., the ligation adapter strand, biotinylated at the 5′ end). High-concentration formamide washing was essential to remove adapters hybridized but not ligated to cDNA 5′ ends, mainly in the unilluminated region. Subsequently, the samples were treated with Proteinase K (Thermo Fisher Scientific), followed by enrichment of biotinylated cDNA using streptavidin-coated magnetic beads. The purified cDNA was then subjected to a second reverse transcription reaction containing a template switching oligo (adapted from the Smart-seq2) to add a PCR sequence at the cDNA 3′ end, after which the cDNA was PCR-amplified and fragmented with Tn5A transposase. The fragmented cDNAs were then amplified to generate the sequencing library (as shown in Fig. 2A; Supplemental Fig. 2).
Overview of PCL-seq for ROI-specific expression analysis. (A) PCL-seq workflow: (1) Fixed and permeabilized tissue sections are subjected to in situ reverse transcription with RT primers carrying PC linkers, synthesizing the first strand of cDNA. (2) Patterned UV illumination of the ROI is performed using the Mosaic system, cleaving the PC linkers and exposing 5′ phosphate groups. (3) The cDNA is ligated to partially double-stranded adapters. The ligation adapter (top strand) is biotinylated at the 5′ end and consisted of three components: a high-throughput sequencing handle, a barcode, and a linker region complementary to the bottom strand. (4) High-concentration formamide washing removes unligated adapters, primarily from non-UV-illuminated regions. (5) After Proteinase K digestion to dissolve tissue, biotinylated cDNA is enriched using streptavidin-coated magnetic beads. A second reverse transcription step introduces the ISPCR sequence at the 3′ end, followed by cDNA amplification. (6) The amplified cDNA is fragmented using Tn5A transposase loaded with Illumina Nextera Read1 sequencing adapters, and sequencing libraries are prepared for downstream analysis. (B) The NIH/3T3 cell line is stained with RT-PC linker-FAM primers during the in situ RT reaction, followed by imaging after photocleavage, ligation, and formamide washing. The elliptical area indicates the illuminated region. Scale bar, 100 µm. (C) PCL-seq specificity is assessed by selectively photo-tagging HEK293 and NIH/3T3 cells in coculture. (D,E) Background signal levels from nonilluminated regions are evaluated in mixed human-mouse cell cultures (n = 3 replicates).
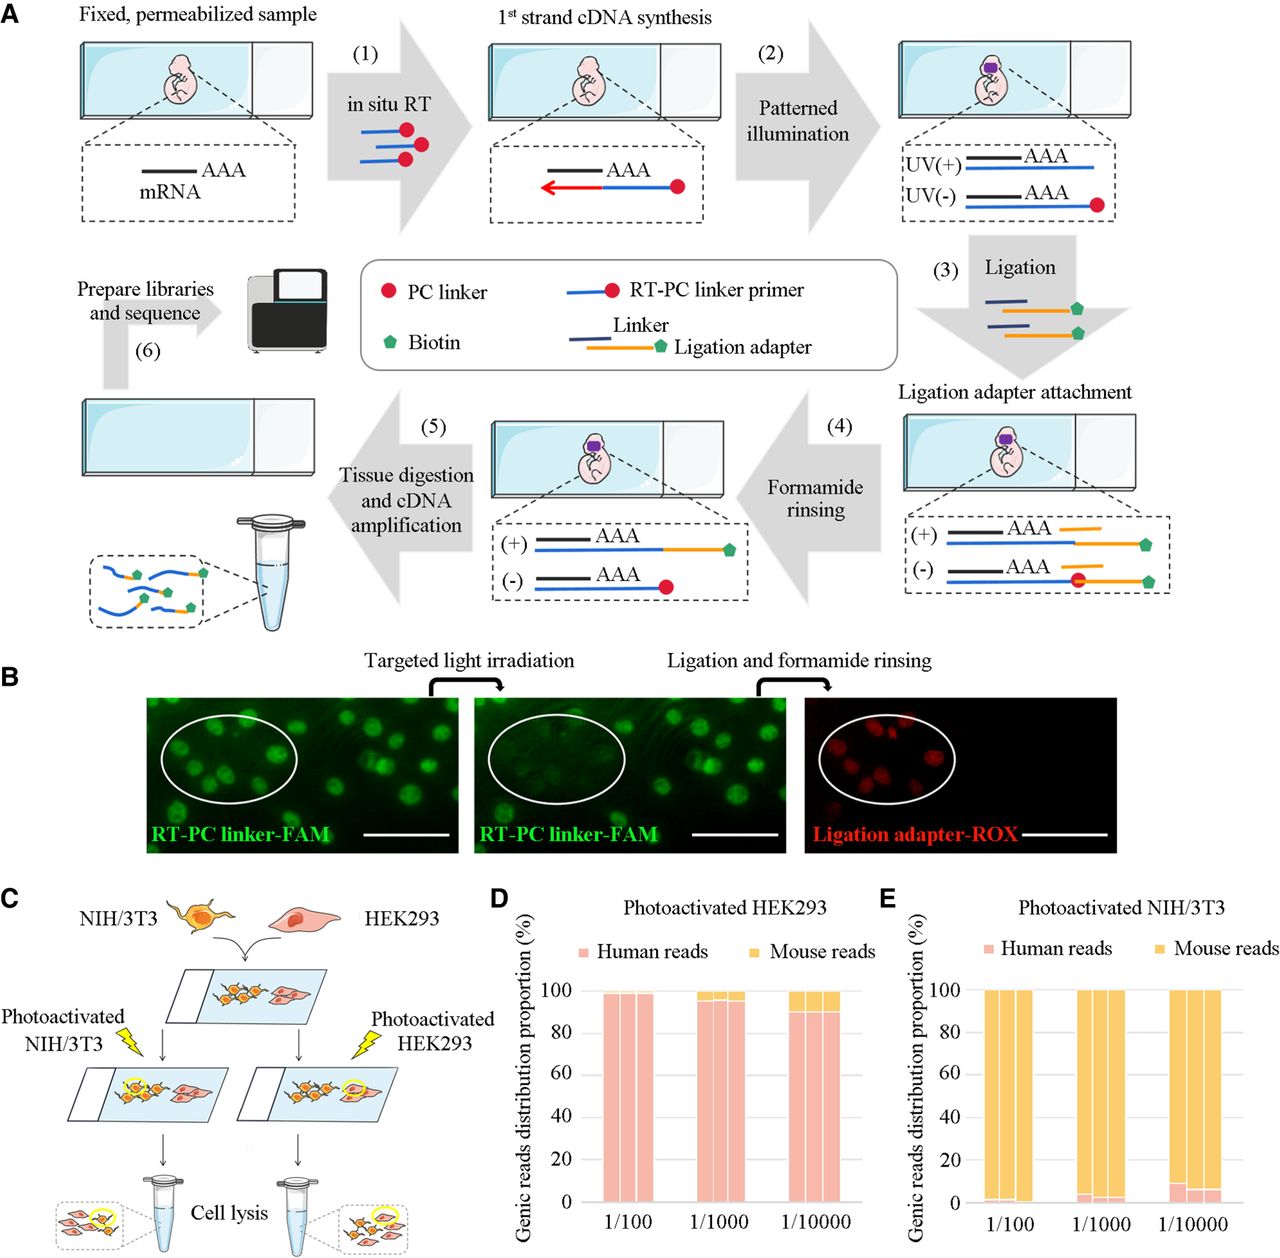
We validated the ability of PCL-seq to specifically capture cDNA from ROIs in cell culture. Initially, we demonstrated specific labeling of cells in illuminated regions using a fluorescently labeled ligation adapter. Specifically, NIH/3T3 cells were fixed, permeabilized, and subjected to in situ RT with RT-PC linker-FAM primers. Afterward, a small region of the cell culture was selectively illuminated using the Mosaic system, followed by the addition of a red fluorescently labeled ligation adapter. Fluorescence imaging revealed specific labeling of cDNA molecules in the illuminated region of the culture (Fig. 2B).
Having confirmed specific adapter attachment to cDNA in photo-illuminated regions, we next evaluated the specificity of PCL-seq in distinguishing cell types. We performed a species-mixing experiment using human and mouse cell lines. For proof-of-concept analysis, HEK293 (human) and NIH/3T3 (mouse) cells were seeded on two adjacent but spatially separated areas of a slide with no intermingling (Fig. 2C). A subset of cells from one species was selectively illuminated in the context of unilluminated cells at ratios of 1/100, 1/1000, and 1/10,000 between illuminated cells and the total population. After in situ reverse transcription, selective photo-illumination was performed, generating three experimental conditions: (1) illuminated HEK293 regions; (2) illuminated NIH/3T3 regions; and (3) non-photocleaved regions (control). Sequencing reads were mapped to a combined human and mouse reference genome to quantify the proportion of genic reads from each species. Libraries generated from the control (nonilluminated) regions yielded negligible sequencing reads (control genic reads vs. experimental genic reads = 5660 vs. 4.6 × 10⁶, respectively) (Supplemental Data), suggesting unilluminated cells contributed minimally to the library. In the HEK293-illuminated condition, human genic read proportions were 99.08% ± 0.07%, 95.38% ± 0.1%, and 90.06% ± 0.06% at ratios of 1/100, 1/1000, and 1/10,000, respectively (mean ± SD) (Fig. 2D). Conversely, when NIH/3T3 cells were illuminated, mouse genic read proportions were 98.96% ± 0.56%, 97.01% ± 0.76%, and 92.84% ± 1.7% at the same ratios (Fig. 2E). These results demonstrate that PCL-seq can effectively and specifically capture mRNA from targeted cells, even when they represent as little as 0.01% of the total population.
PCL-seq for fresh-frozen tissue sections
First, we used mouse embryos to validate PCL-seq for ROI-specific gene expression analysis on tissue sections. Adjacent fresh-frozen sections of embryonic day 13.5 (E13.5) mouse embryos were fixed, permeabilized, and subjected to in situ RT. Sections were subsequently immunostained for PAX6, a key gene in eye development expressed broadly in the neuroectoderm and epidermal ectoderm during eye development (Smith et al. 2009; Heavner and Pevny 2012), to identify the eye region. PAX6-positive and PAX6-negative domains were independently photo-illuminated using a 20× objective lens (Supplemental Fig. 3A). Following lysis, cDNA libraries were amplified and sequenced. At an average sequencing depth of 7.3 million read pairs per sample, we detected an average of 87,824 ± 6487 UMIs (unique molecular identifiers) in PAX6-positive and 128,533 ± 2680 UMIs in PAX6-negative regions (100-µm diameter circular areas), corresponding to 6623 ± 123 genes and 8642 ± 222 genes, respectively (n = 4 replicates, mean ± SD) (Supplemental Fig. 3B). This translates to sensitivity levels of 1119 ± 83 UMIs/100 µm² for the PAX6-positive and 1637 ± 34 UMIs/100 µm² for the PAX6-negative regions (n = 4 replicates, mean ± SD) (Supplemental Fig. 3C).
To determine whether the captured gene expression originated from cells within the light-illuminated regions, we analyzed the expression of Gapdh and Pax6 genes in the PAX6-positive and PAX6-negative regions using DESeq2 (Supplemental Fig. 3D,E; Love et al. 2014). The expression of the Pax6 gene was over fivefold in the positive region compared to the negative region, consistent with the pattern revealed by PAX6 antibody staining. Conversely, Gapdh expression was detected in both regions with no significant expression difference. These results provided preliminary evidence for the correlation between spatial localization and gene expression. Next, we conducted a comprehensive differential genes expression (DEGs) analysis between the PAX6-positive and PAX6-negative regions. A two-dimensional principal component analysis (PCA) revealed distinct expression profiles (Supplemental Fig. 3F). DEGs analysis identified 2155 upregulated and 4016 downregulated genes in PAX6-positive versus PAX6-negative regions, as shown in the volcano plots (Supplemental Fig. 3G). Besides Pax6, upregulated genes included Pmel, Trpm1, Tyr, Rpgrip1, and Oca2, all of which are associated with eye development (Wang et al. 2010; Karia et al. 2013; Liu et al. 2020). Additionally, PCL-seq identified genes such as Ppip5k1 and Nsmce1 in the upregulated matrix, which have not been previously studied in mouse embryonic eye development but were validated with immunohistochemical staining results from the EMAP Gene Expression Database (https://www.emouseatlas.org/emap/home.html). Ppip5k1 is involved in phosphate and bioenergetic homeostasis (Shears et al. 2017), whereas Nsmce1 has been linked to neurological diseases (Gong et al. 2020). These findings demonstrate the ability of PCL-seq to generate transcriptome maps of specific ROIs in tissue sections.
To validate the reliability of PCL-seq, we compared the data with E13.5 mouse embryonic spatial transcriptomics data generated using Visium technology (NCBI Gene Expression Omnibus [GEO; https://www.ncbi.nlm.nih.gov/geo/] accession number GSM6619681) (Llorens-Bobadilla et al. 2023). For the Visium data, we selected three spots in the eye region based on hematoxylin and eosin (H&E)-stained morphology (Supplemental Fig. 3H). Comparing these spots with the PCL-seq data revealed a gene overlap exceeding 80% (Supplemental Fig. 3I) and a gene expression correlation of 0.7 (Supplemental Fig. 3J), confirming the consistency and accuracy of PCL-seq data.
To further assess PCL-seq's ability to target specific tissue structures, we analyzed the mitral cell layer (MCL) and outer plexiform layer (OPL) regions of the mouse olfactory bulb. The MCL, an irregularly shaped ROI defined by distinct morphological features, was selected as a biologically relevant structure, whereas the OPL, with its regular square-shaped ROI (80 µm × 80 µm), was used as a reference. Before investigating gene expression in the MCL region, we evaluated the spatial resolution of PCL-seq. The resolution measured under the 20× objective lens was 2.49 ± 0.67 µm (mean ± SD, n = 11 points) (Supplemental Fig. 4), likely constrained by optical scattering and system limitations. Slightly retracting ROI boundaries within morphological borders improved the ability to capture region-specific gene expression.
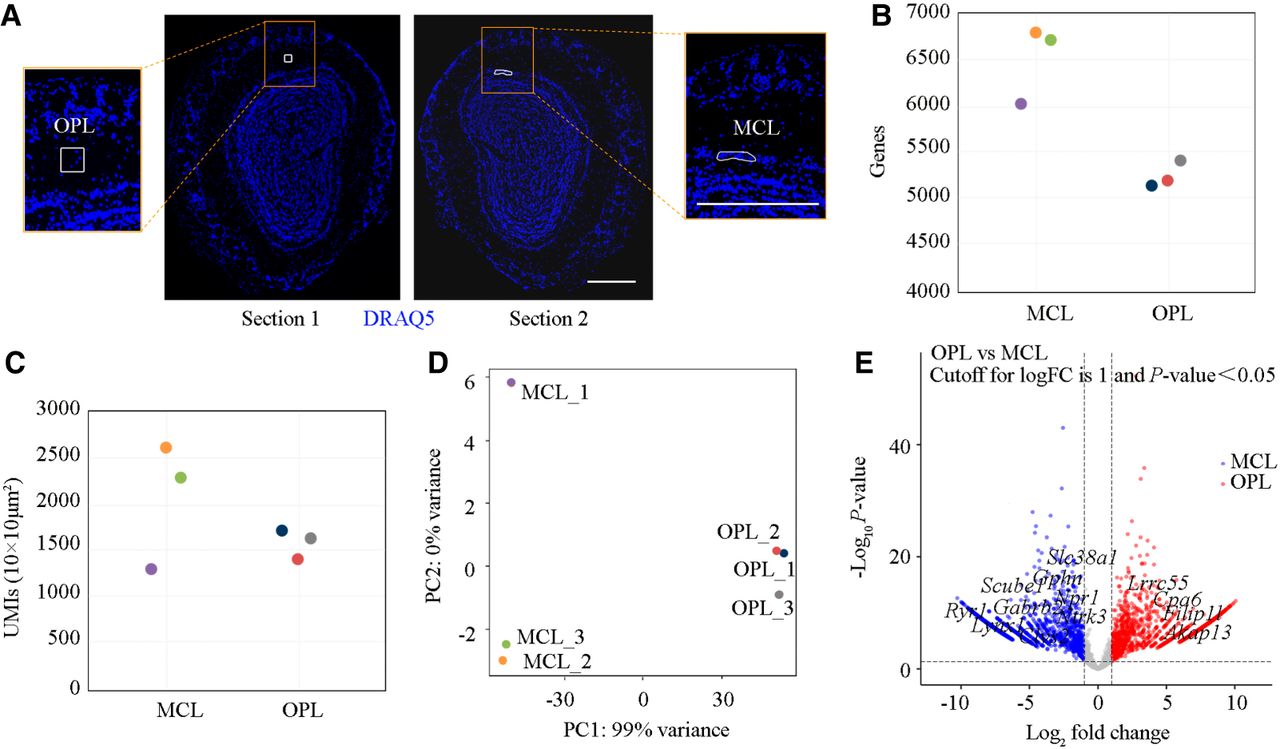
Using PCL-seq, we analyzed adjacent coronal sections of the mouse olfactory bulb. Structural features of the MCL and OPL were identified using DRAQ5 staining (Fig. 3A). At a sequencing depth of 9.4 million reads, we detected an average of 6506 ± 411 genes in the MCL (irregular shape) region and 5234 ± 159 genes in the OPL (80 µm × 80 µm, mean ± SD, n = 3 replicates) (Fig. 3B). Sensitivity was 2055 ± 698 UMIs/100 µm² in the MCL and 1579 ± 167 UMIs/100 µm² in the OPL (mean ± SD, n = 3 replicates) (Fig. 3C). PCA revealed distinct expression profiles for the two regions (Fig. 3D). Whereas PC1 (99% variance) captured the major separation between MCL and OPL groups, minor variations among MCL samples along PC2 (<1% variance) were observed. These subtle differences between MCL1 and MCL2/3 likely reflect normal biological variability, as confirmed by standardized experimental procedures and the absence of technical artifacts in DESeq2 analysis. DEGs analysis identified 2804 differentially expressed genes, visualized in volcano plots (Fig. 3E). MCL-specific genes, such as Gphn, Lynx1, Gabrb2, Clvs2, and Nprl, and OPL-specific genes, including Filip1l, Cpa6, Lrrc55, and Akap13, were consistent with ISH data from the Allen Brain Atlas (https://atlas.brain-map.org/). These results demonstrate that PCL-seq is effective in capturing gene expression within anatomically heterogeneous tissue structures. Its ability to adapt to irregularly shaped ROIs highlights its utility for exploring spatially resolved transcriptomics in complex tissue samples.
Analysis of PCL-seq for ROI-specific profiling in the fresh-frozen mouse olfactory bulb. (A) Two specific regions, the mitral cell layer (MCL) and outer plexiform layer (OPL), were selected from adjacent slices. The blue signal indicates pseudocolor derived from DRAQ5 staining. Scale bar, 500 µm. (B) The number of detected genes in each ROI is shown. (C) The number of UMIs per 100 µm² is shown for each ROI. (D) Principal component analysis (PCA) illustrates the distribution of samples based on expression profiles in two dimensions. (E) Volcano plot illustrating differentially expressed genes between OPL and MCL regions (|log2FC| > 1, P < 0.05). A total of 1237 genes were significantly upregulated (red) and 1567 genes downregulated (blue). Axes: x, log2(fold change); y, −log10(P value). Selected marker genes with significant differential expression are highlighted.
PCL-seq for Formalin-Fixed Paraffin-Embedded tissue sections
Formalin-Fixed Paraffin-Embedded (FFPE) samples are widely used in clinical practice to store pathological tissues (Fassunke et al. 2015). However, the use of formalin and prolonged storage lead to varying degrees of RNA degradation and reduced mRNA accessibility, complicating transcriptome analysis in such specimens (Hoffman et al. 2015). Recently, several approaches have been developed for unbiased, spatially resolved transcriptomics of FFPE samples (Gracia Villacampa et al. 2021; Bai et al. 2024). These methods aim to improve mRNA accessibility through heat-induced crosslink reversal, thus enabling transcriptomic analysis of FFPE tissue sections.
In this study, we combined PCL-seq with decrosslinking to investigate spatial differences in gene expression in FFPE sections of E15.5 mouse embryos. To evaluate the performance of PCL-seq across different tissue types, we used mouse embryonic digit and vertebra tissues as model systems. Adjacent sagittal sections of E15.5 mouse embryos were subjected to crosslink reversal, followed by PCL-seq. The digit and vertebra regions were photo-illuminated using a 20× objective lens (Fig. 4A). At an average sequencing depth of 10 million read pairs per sample, the average number of genes detected in the digit (100-µm diameter circular area) and vertebra (100-µm diameter circular area) regions was 4978 ± 686 and 5066 ± 303 (mean ± SD, n = 4 replicates), respectively (Fig. 4B). Similarly, the sensitivity, measured as the number of UMIs per 100 µm², was 546 ± 189 in the digit region and 424 ± 90 in the vertebra region (mean ± SD, n = 4 replicates) (Fig. 4C).
PCL-seq analysis of FFPE mouse embryo sections. (A) Hematoxylin and eosin (H&E) staining was performed on adjacent mouse embryo sections to highlight distinct ROIs. The digit and vertebra regions were selectively photoilluminated to define specific areas for analysis. Each illuminated region was circular, with a diameter of 100 µm. Scale bar, 250 µm. (B) The number of identified genes in each region is shown. (C) The number of UMIs detected per 100 µm² is shown. (D) PCA illustrates the separation of expression profiles between digit and vertebra ROIs in two dimensions. (E) Volcano plot illustrating differentially expressed genes between digit and vertebra regions (|log2FC| > 1, P < 0.05). A total of 849 genes were significantly upregulated (red) and 868 genes downregulated (blue). Axes: x, log2(fold change); y, −log10(P value). Selected marker genes with significant differential expression are highlighted.
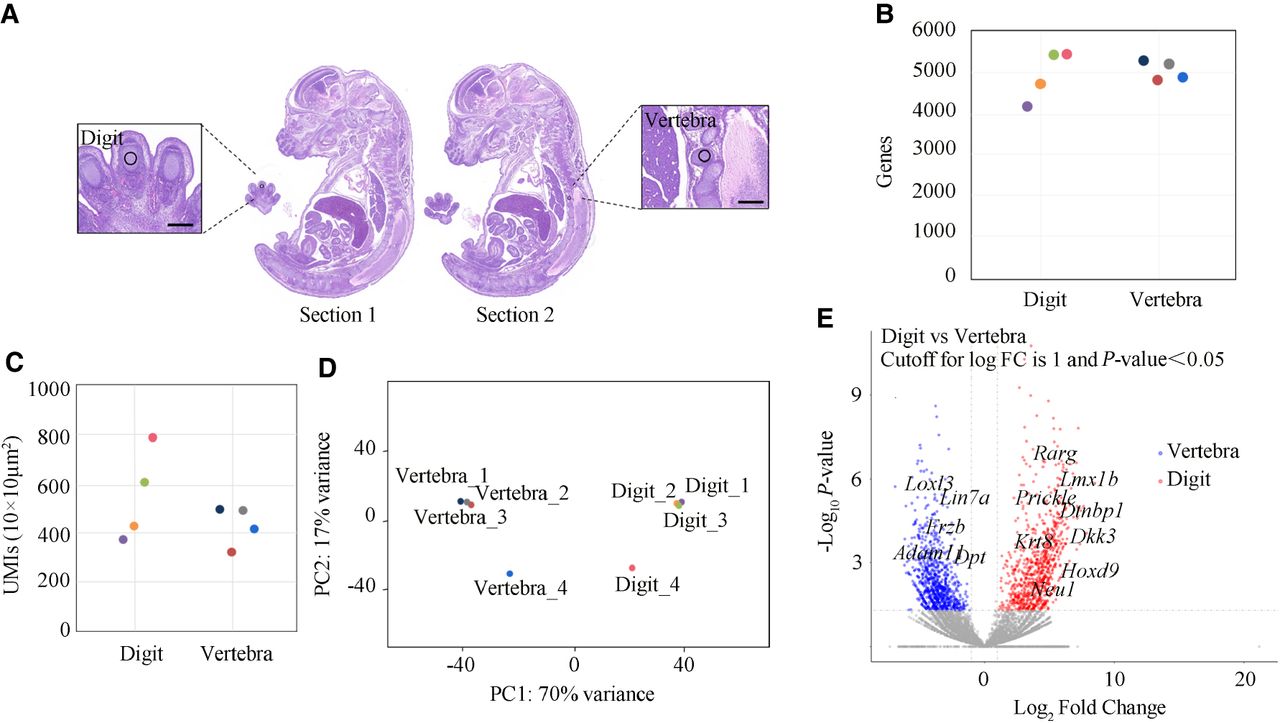
PCA revealed distinct expression patterns between the digit and vertebra regions (Fig. 4D). Differential gene expression analysis identified a total of 1717 DEGs between the two regions (Fig. 4E). To further analyze these DEGs, we consulted the Gene Ontology (GO) database (https://geneontology.org/) for gene sets associated with limb and spine development. Key GO terms, including those related to limb development (GO:0060173) and spine development (GO:0060996), were retrieved and matched with the DEGs. Many genes associated with these biological processes were identified, including those involved in limb morphogenesis (e.g., Gli1, Hoxd9, Fgfr3, Tbx4) and vertebral development (e.g., Bmp7, Hoxa7) (Fig. 4E). To validate the spatial expression patterns of these genes, we retrieved ISH data from the EMAP Gene Expression Database (https://www.emouseatlas.org/emap/home.html) using its EMAGE module. ISH results for matched genes from the GO analysis were compared to spatial patterns identified by PCL-seq. The spatial expression patterns of representative genes showed high consistency between PCL-seq and ISH results (Supplemental Fig. 5), demonstrating that PCL-seq accurately captures region-specific gene expression in FFPE tissues.
PCL-seq achieves subcellular resolution expression profiling
Subcellular resolution enables precise localization of gene expression within distinct subcellular structures, which is critical for elucidating gene functions and regulatory mechanisms (Turner-Bridger et al. 2018; Das et al. 2021). Based on the estimated resolution, ∼3 µm under a 20× objective lens is theoretically sufficient to meet the requirements of PCL-seq for analyzing subcellular structures (Supplemental Fig. 4). Accordingly, we investigated the potential of PCL-seq to generate transcriptomic maps of subcellular structures
HeLa cells were cultured on coverslips and allowed to fully spread. Following in situ RT reactions, cytoplasmic and nuclear regions were labeled with an anti-ubulin antibody and DRAQ5 dye, respectively. Approximately 200 nuclear or cytosolic ROIs, each measuring 5 µm in diameter, were photo-irradiated (partially shown in Fig. 5A). At an average sequencing depth of 4.1 million read pairs per sample, an average of 4347 ± 230 genes was detected in nuclei, compared to 3060 ± 545 genes in the cytosol (mean ± SD, n = 3 replicates) (Fig. 5B). The sensitivity, measured as the number of UMIs per 100 µm², was 1954 ± 117 in nuclear regions and 2477 ± 616 in cytoplasmic regions (mean ± SD, n = 3 replicates) (Fig. 5C).
PCL-seq for subcellular gene expression analysis. (A) Immunofluorescence staining of HeLa cells, with the cytoplasm labeled using Alexa Fluor 488-conjugated anti-tubulin antibody (green) and the nucleus stained with DRAQ5 dye (red). Tubulin-positive and DRAQ5-positive regions were selectively photoilluminated to distinguish subcellular areas. Scale bar, 100 µm. (B,C) The number of detected genes (B) and uniquely mapped UMIs per 100 µm² (C) are shown. (D) PCA visualizing the two-dimensional expression profiles of subcellular regions. (E) Volcano plot illustrating differentially expressed genes between nuclear and cytoplasmic compartments (|log2FC| > 1, P < 0.05). A total of 647 genes were significantly upregulated (red) and 421 genes downregulated (blue). Axes: x, log2(fold change); y, −log10(P value). Selected marker genes with significant differential expression are highlighted.
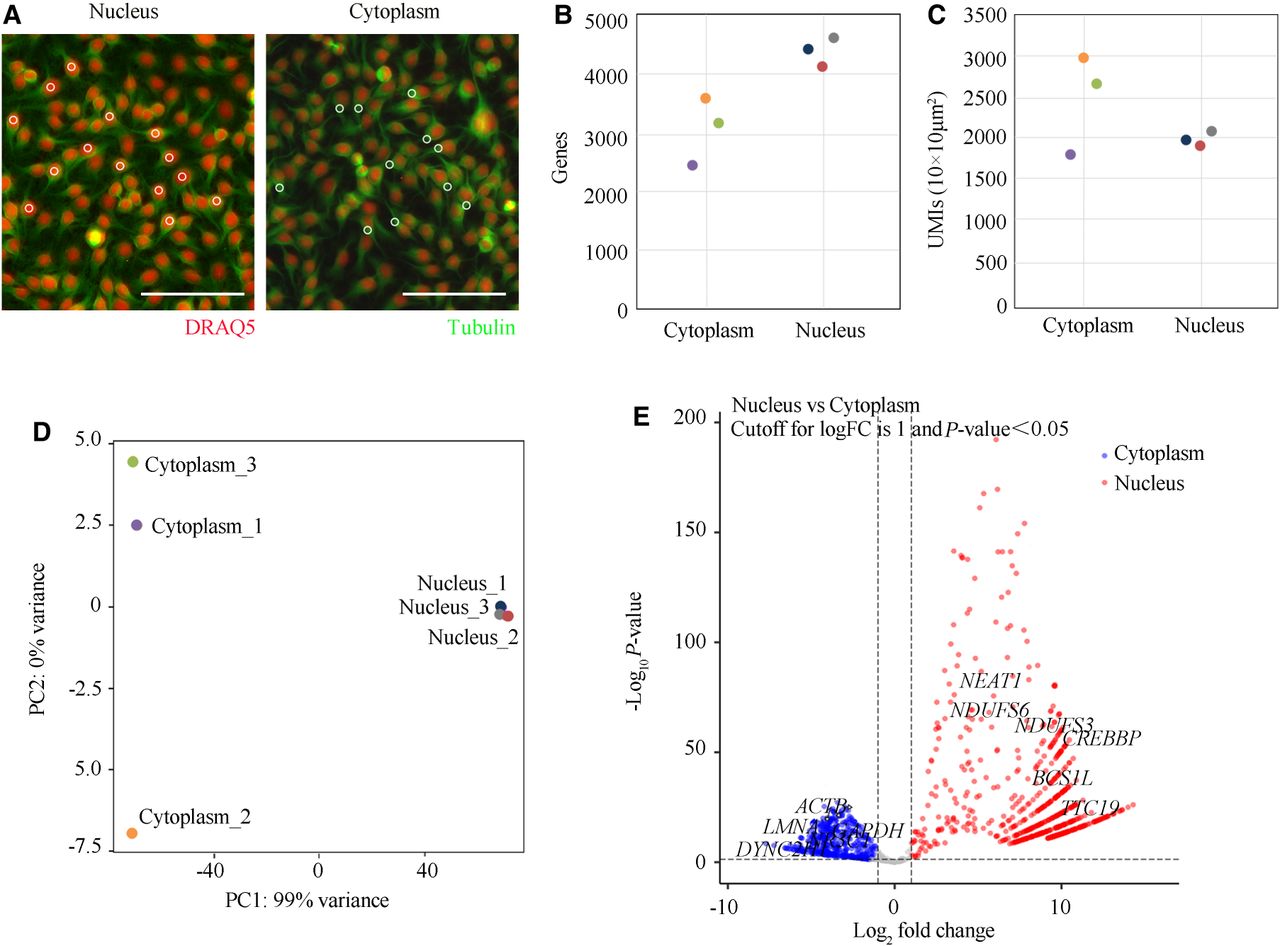
Dimensionality reduction of expression profiles demonstrated that nuclear and cytoplasmic regions were well separated (Fig. 5D). Differential gene expression analysis revealed 1068 DEGs between nuclear and cytoplasmic transcriptomes (Fig. 5E). Many of these DEGs matched annotations in the GeneCards database, including nuclear-specific genes (NEAT1, BCS1L, TTC19, NDUFS3) and cytoplasmic-specific genes (GAPDH, ACTB, LMNA) (Fig. 5E). To validate the accuracy of PCL-seq in capturing true subcellular gene expression profiles, we performed deconvolution and correlation analyses using nuclear and cytoplasmic bulk RNA-seq reference data from a previous study (Cui et al. 2024). Deconvolution analysis showed that physically isolated nuclei and cytoplasm transcriptional profiles from the reference study achieved complete separation of nuclear and cytoplasmic gene compositions. Results from the subcellular PCL-seq experiment revealed that >97% of nuclear sample genes originated from nuclei, highlighting robust nuclear-cytoplasmic separation (Supplemental Fig. 6A). Pearson's correlation analysis further confirmed consistency between PCL-seq and reference data, with strong correlations observed between nuclear and cytoplasmic samples (Supplemental Fig. 6B).
In summary, PCL-seq achieved accurate spatial gene profiling at subcellular resolution, providing a reliable tool for studying subcellular transcriptomics.
Discussion
Clinical pathology tissue samples, particularly those derived from complex and heterogeneous organs such as tumors or the brain, present significant challenges for accurate data acquisition using conventional methods. This challenge arises from distinct spatial variations in gene expression and cellular architecture that cannot be effectively captured by bulk transcriptome analyses. Spatial transcriptomics, particularly ROI-based methods, has emerged as a powerful approach to overcome these challenges. By focusing on specific anatomical regions or cell types within a spatial context, ROI-based transcriptomic analysis enables precise profiling of gene expression, revealing molecular differences that remain obscure in whole-sample analyses. For example, distinguishing normal from diseased regions within a tissue provides critical insights into disease-associated molecular mechanisms and spatially regulated gene networks. These insights enhance the understanding of pathogenesis and facilitate the identification of precise molecular targets for personalized therapeutics.
To address the need for an accessible and high-performance spatial transcriptomic method for ROI analysis, we developed PCL-seq that utilizes PC linker-based photo conversion chemistry to selectively label RNA transcripts in ROI. When benchmarking PCL-seq against existing spatial transcriptomics platforms, it demonstrates several key advantages (Supplemental Table 1): (1) Enhanced compatibility with diverse sample types. PCL-seq supports a broad range of sample types, including both fresh-frozen and FFPE tissue sections. In contrast, noncommercial methods such as PIC (Honda et al. 2021) and Light-seq (Kishi et al. 2022) are largely restricted to fresh-frozen tissues. The ability to utilize FFPE samples makes PCL-seq particularly valuable for clinical and pathological studies, where FFPE samples are commonly used. (2) Wide species compatibility. PCL-seq is based on poly(A) priming and thus works with a wide range of species, from animal to plant, theoretically. In comparison, commercial platforms like GeoMx DSP rely on species-specific hybridization probes, limiting their use primarily to human and murine studies. (3) Simplified workflow suitable for laboratories with different resources. Whereas the workflow complexity of PCL-seq is comparable to noncommercial methods such as PIC (Honda et al. 2021) and Light-seq (Kishi et al. 2022), PCL-seq offers broader applicability. (4) Cost-effectiveness and high sensitivity. PCL-seq is highly cost-efficient compared to both commercial platforms and noncommercial methods. The costs of PC linker modification in primers used in PCL-seq is only a fraction (tens of U.S. dollars) compared to the photo-caged primers (thousands of U.S. dollars) used in other ROI study techniques such as PIC (Honda et al. 2021) and Light-seq (Kishi et al. 2022), with comparable, if not better, sensitivity.
Future directions for PCL-seq include expanding its applications to multiomics, automating high-throughput analysis, and implementing AI-assisted image processing for improved ROI selection. In multicellular systems, spatially specific gene expression is driven by chromatin structures and epigenetic modifications (Holoch and Moazed 2015; Peixoto et al. 2020). Thus, PCL-seq could evolve beyond studying the spatial transcriptome. A novel approach, photo-selective sequencing, integrates the PC linker with ATAC-seq (Buenrostro et al. 2013) to facilitate spatial analysis of ROIs at the chromatin level (Mangiameli et al. 2023). This implies that incorporating PC linkers into Tn5 mosaic end adapters and RT primers enables the simultaneous study of chromatin accessibility and transcriptomic profiles from the same tissue section. Furthermore, modifications to PC linkers for use with the PA-Tn5 enzyme (Kaya-Okur et al. 2019) and antibody-oligonucleotide complexes (Stoeckius et al. 2017) could facilitate spatially resolved epigenetic and proteomic analyses. These advances would provide deeper insights into the interplay between gene regulation layers and the complex mechanisms controlling cellular function.
Whereas PCL-seq achieves high-resolution spatial profiling within individual ROIs, broader applications are currently constrained by technical limitations in throughput and ROI discrimination. The moderate ligation efficiency (∼60%) and consequent barcode crossover present challenges for reliable multi-ROI analysis within single tissue sections (Supplemental Data). To address these limitations, future development should focus on integrating automated high-throughput platforms with AI-assisted image analysis. Robotic workstations and high-throughput imaging systems could substantially improve processing capacity while minimizing barcode crossover through physical ROI segregation. Concurrently, machine learning algorithms could enhance ROI selection accuracy by improving boundary delineation and reducing illumination spillover effects. This combined approach, leveraging both engineering automation and computational intelligence, would significantly enhance the scalability and precision of PCL-seq, particularly for complex applications requiring simultaneous multi-region analysis, such as studies of tumor heterogeneity or developmental patterning.
Thus, PCL-seq represents not only a significant advancement in spatial transcriptomics but also an adaptable foundation for future developments in multiomics technologies. Its combination of cost-effectiveness, reproducibility, and flexibility positions it as an essential tool for advancing our understanding of cellular heterogeneity, spatial molecular mechanisms, and tissue architecture.
Methods
Cells
HEK293, NIH/3T3, and HeLa cells were cultured according to standard procedures in high-glucose DMEM (Gibco, 11965092) supplemented with 10% FBS (Gibco, 10270-106) and 1% penicillin-streptomycin (Nacalai Tesque, 0503) at 37°C with 5% CO2. To prepare for the cell experiments, we seeded the cells onto poly-L-lysine-coated glass slides. Briefly, cells were collected from culture dishes using trypsin (Gibco, 25200056). The centrifuged cell suspension was then dripped onto a slide, where it was plated overnight at 37°C. The slides were fixed with 4% formaldehyde (Sigma-Aldrich, F8775) prior to further experiments.
Preparation of mixed-species cell coverslips
HEK293 cells (human) and NIH/3T3 cells (mouse) were seeded onto the same coverslip, spatially adjacent but completely separate without intermingling. In the HEK293 as target, NIH/3T3 as background experiment, the coverslip contained 150 HEK293 cells and 10,000 NIH/3T3 cells. The total number of cells was kept consistent across all three experimental conditions. Depending on the proportion of illuminated area, the number of illuminated target cells were 1, 10, or 100 of the 150 HEK293 cells and were illuminated for 1/10,000, 1/1000, and 1/100 testing condition. Conversely, in the NIH/3T3:HEK293 as target:background test, the coverslip contained 150 NIH/3T3 and 10,000 HEK293 cells. The numbers of illuminated target cells under each illumination proportion were set the same as for the HEK293 condition.
Mice
C57BL/6J mice were purchased from Jinan Pengyue Laboratory Animal Breeding Co., Ltd. The study was approved by the Animal Care and Use Committee of Ocean University of China. E13.5 mouse embryos were dissected and transferred into a cryomold prefilled with prechilled OCT compound (Sakura, 4583) for embedding. The cryomold was immediately placed on dry ice until the OCT compound was fully frozen. Before sectioning, the frozen tissue block was warmed to the cryostat temperature (−20°C). Cryosections at a thickness of 10 µm were mounted on poly-L-lysine-coated glass slides. The frozen slides were then fixed with 4% formaldehyde or directly stored at −80°C for long-term storage.
Additionally, to obtain FFPE samples, E15.5 mouse embryos were fixed in 4% formaldehyde at 4°C overnight. Following fixation, the embryos were processed for paraffin embedding and sectioning by Wuhan Servicebio Technology Co., Ltd. to provide FFPE biological samples for subsequent research.
Functionalized slide screening for optimal illumination conditions
First, the NH2-RT-PC linker-FAM primer (all primer sequences used in this study are available in Supplemental Table 2) was conjugated to the CodeLink slide surfaces. Briefly, the primer was dissolved in 10 mM sodium phosphate buffer to prepare a 100 µM stock solution. The print buffer was prepared as follows: 300 mM sodium phosphate buffer (pH 8.5) and 10 µM NH2-RT-PC linker-FAM primer. The print buffer was applied to the CodeLink slides, and the incubation area was marked. The slides were then placed in a saturated sodium chloride humid chamber and incubated overnight in the dark at room temperature. After overnight incubation, the slides were treated with a preheated blocking solution (50 mM ethanolamine, 0.1 M Tris, pH 9) to block any remaining active groups. The blocking was performed at 50°C for 30 min. Following the blocking step, the slides were briefly rinsed with deionized water. Next, 10 mL of preheated washing solution (4× SSC, 0.1% SDS) at 50°C was added to the slides, which were then washed on a shaker for 30 min. After a brief rinse with deionized water, the slides were dried, and green fluorescence in the reaction area under a microscope indicated successful conjugation.
Subsequently, different areas of the slides were exposed to UV light at intensities of 10%, 40%, 70%, and 100% power for durations of 10, 20, and 30 sec. After washing with PBS, the slides were observed under a fluorescence microscope, and fluorescence intensity was recorded for each condition.
Fluorescent labeling of ROI
Two fluorescently labeled primers (RT-PC linker-FAM and Ligation adapter-ROX) were employed to perform staining of CodeLink slides and tissue sections within the ROI. For CodeLink slides, the RT-PC linker-FAM primer was conjugated to the surface of the slide using the aforementioned method and directly exposed to UV light. For tissue sections, the fluorescently modified primers needed to be introduced via an RT reaction, followed by downstream processing. Tissues were fixed with 4% formaldehyde and subsequently permeabilized with 0.1% Triton X-100. The hybridization buffer contained 2× SSC (Invitrogen, 15557044), 10% formamide (Solarbio, F8120-100), 50% dextran sulfate (Sigma-Aldrich, 67578), 1% RNase inhibitor (Takara, 2313A), and 1 µM RT-PC linker-FAM primer. It was applied to the samples for 30 min at room temperature. The slides were washed three times with 2× SSC. They were then incubated with an RT mix containing 1× RT buffer (Thermo Fisher Scientific, EP0751), 100 µM dNTPs (Thermo Fisher Scientific, R0191), 1% RNase inhibitor, and 25 U/µL Maxima H Minus Reverse Transcriptase (Thermo Fisher Scientific, EP0751) for 90 min at 42°C. After washing with PBS, the target region was illuminated with UV light at 100% power for 10 sec. Subsequently, the slides were rinsed with PBS for 3 min, and then 1 µM Ligation adapter-ROX/Linker primer was hybridized to the samples for 15 min at room temperature. After washing with 2× SSC, a ligation mix containing 1× T4 buffer (NEB, M0202L) and 20 U/µL T4 DNA ligase (NEB, M0202L) was added to the samples. The samples were then incubated for 30 min at 37°C. After washing with 65% formamide, imaging was performed using a Nikon ECLIPSE Ti2 inverted microscope.
PCL-seq protocol for fresh-frozen tissue section
Fixation and permeabilization
Fresh-frozen tissue sections were fixed with 4% formaldehyde for 10 min at room temperature, and the cross-link was then quenched with 1.25 M glycine for 5 min. Sections were permeabilized with 0.5% Triton X-100 for 3 min and then with 0.1 N HCl for 5 min, followed by neutralization with 1 M Tris-HCl (pH 8.0) for 10 min at room temperature. Typically, cells were fixed with 4% formaldehyde at room temperature for 10 min, followed by permeabilization with 0.1% Triton X-100 at room temperature for 20 min. These conditions were used for the pretreatment of cell coverslips, and downstream processing was consistent with that of tissue sections.
Reverse transcription
RT-PC linker primers were hybridized to the tissue section using a hybridization buffer solution consisting of 2× SSC, 10% formamide, 50% dextran sulfate, and 1% RNase inhibitor. Hybridization was performed for 30 min at room temperature. Subsequently, the section was rinsed three times with 2× SSC and once with 1× RT buffer. Following these rinses, the section was incubated in a reverse transcription mix containing 1× RT buffer, 100 µM dNTPs, 1% RNase inhibitor, and 25 U/µL Maxima H Minus Reverse Transcriptase for 90 min at 42°C.
Immunofluorescence staining (optional)
To prevent nonspecific interactions, the specimens were blocked with 1% BSA for 1 h at room temperature, followed by three washes with PBST. Subsequently, the tissue sections were incubated with Alexa Fluor 647 anti-PAX6 antibody (Abcam, ab215925) for 2 h at room temperature. After incubation, the sections were rinsed three times with PBST to complete the fluorescent staining. Based on the staining results, ROI could then be selected.
For HeLa cells, immunofluorescence staining was performed using an anti-tubulin antibody to visualize the cytoplasmic region. Additionally, DRAQ5 (Invitrogen, 65-0880-96) was used to indicate the nuclear location. Briefly, after the RT reaction, cells were blocked with 1% BSA for 1 h at room temperature. After three washes with PBST, the cells were incubated with Alexa Fluor 488 anti-tubulin antibody (Abcam, ab197737) for 2 h at room temperature to stain the cytoplasm. Following another PBST wash, the cells were incubated with 10 µM DRAQ5 dye for 30 min at room temperature. The cells were then rinsed with PBST to prepare for subsequent reactions.
Blocking reaction
To prevent large tissue areas from being ligated with adapters due to background shedding of the PC linker during primer synthesis, blocking primers were employed to block RT primers lacking the PC linker. Briefly, 10 µM linker strands complementary to the RT primer and 10 µM blocking primers (nonamplification arm strands) were hybridized to the section for 15 min at room temperature. Following hybridization, the slides were rinsed with 2× SSC and then with 1× T4 buffer. A ligation mix containing 1× T4 buffer and 20 U/µL T4 DNA ligase was applied to the section and incubated for 30 min at 37°C. Finally, the slides were washed with 65% formamide to remove single strands complementary to the RT primers, allowing for subsequent specific primer hybridization in the illuminated area.
Photocleavage of the PC linker
Photocleavage of the PC linker was performed using a customized Nikon ECLIPSE Ti2 inverted microscope fitted with a Mosaic Digital Mirror Device from Andor. The DMD comprises an array of individually addressable micromirrors that can be switched “on” and “off.” In the imaging software, the defined ROI was converted into a mask, which was reflected in the micromirrors. The ROI was selected based on specific tissue morphology and fluorescent markers. The imaging software allowed manual or automated delineation of the ROI using tools such as freehand drawing or geometric shapes. This patterned light was then directed through the microscope objective onto the sample. During the process, a slide containing the tissue was positioned face-up toward the objective to allow the UV light to illuminate the tissue without passing through the glass to avoid light deflection. The desired ROI was illuminated using 100% power for 10 sec to accomplish photocleavage, and the broken PC linker was thoroughly cleaned with PBS.
To ensure experimental reproducibility, the microscope satisfied the following requirements: (1) compatibility with the Andor Mosaic system; (2) compatibility with light sources suitable for photocleavage (e.g., laser or LED UV light sources); (3) a high-precision motorized sample stage to ensure accurate positioning and targeting during photocleavage; and (4) software that provides integration of microscopic stage control, Andor system, and light source, etc.
Ligation reaction
After rinsing the slides with PBS for 3 min, 1 µM linker strands and 1 µM ligation adapter were hybridized to the section for 15 min at room temperature. The slides were then washed with 2× SSC followed by 1× T4 buffer. A ligation mix, consisting of 1× T4 buffer and 20 U/µL T4 DNA ligase, was applied to the section and incubated for 30 min at 37°C. After incubation, the slides were washed with 65% formamide to remove nonspecifically bound sequences.
cDNA collection and purification
An incomplete reverse-crosslinking solution containing 50 mM Tris-HCl, 1 mM EDTA, 0.2 M NaCl, and 1 mg/mL Proteinase K was added to the tissue section for 2 min at 55°C. The mixture was then carefully transferred to an Eppendorf tube. The glass slide was rinsed three additional times with the same buffer, and the wash solutions were collected into the same tube. SDS was added to a final concentration of 1% to the tissue lysate, and the mixture was incubated overnight at 55°C. The reverse-crosslinked product was purified using Ampure XP beads (Beckman, A63880) at a 0.6× ratio. The mRNA-cDNA complex was then collected and further purified using Dynabeads MyOne Streptavidin C1 beads (Thermo Fisher Scientific, 65001). The streptavidin beads were washed three times with binding buffer containing 10 mM Tris-HCl (pH 7.5), 1 mM EDTA, and 1 M NaCl, and then resuspended in the same buffer. The purified product was mixed with the washed streptavidin beads and vortexed at 1600 rpm for 30 min at room temperature. Finally, the beads were thoroughly washed with wash buffer 1 (1× SSC, 0.1% SDS) once for 15 min at room temperature and wash buffer 2 (0.1× SSC, 0.1% SDS) three times for 10 min at 65°C.
Template switching and PCR amplification
The cDNAs bound to the beads were resuspended in a template switching solution containing 1× RT buffer, 1 mM dNTPs, 1 µM TSO primer, 1% RNase inhibitor, and 2 U/µL Maxima H Minus Reverse Transcriptase. The reaction was incubated at 42°C for 90 min. Subsequently, a PCR mix containing KAPA HIFI HotStart Master Mix (Kapa Biosystems, KB2500) with 1× KAPA buffer, 0.3 M dNTPs, 0.2 mM MgCl2, 0.4 µM ISPCR primer, and 1 U/µL HotStart HIFI enzyme was added to the template switching product. The PCR was carried out with the following conditions: an initial incubation at 98°C for 3 min, followed by 23 cycles of 98°C for 20 sec, 67°C for 10 sec, and 72°C for 6 min, with a final extension at 72°C for 5 min. The PCR product was purified using Ampure XP beads at a 0.6× ratio and eluted in 10 µL of 10 mM Tris-HCl (pH 8.0). The cDNA yield was quantified using a Qubit fluorometer (Invitrogen).
Library preparation
To construct the sequencing library, the purified cDNAs were diluted to a concentration of 1 ng/µL and subjected to tagmentation with Tn5A transposase for 10 min at 55°C. The reaction was quenched with 0.2% SDS, and the product was purified using Ampure XP beads at a 1× ratio. The cDNAs were then amplified using KAPA HIFI Master Mix (Kapa Biosystems, KK2602) with 1× KAPA buffer, 0.3 M dNTPs, 0.2 mM MgCl2, 0.2 µM P7 primer, 0.2 µM S5 primer, and 1 U/µL HIFI enzyme. PCR was conducted with the following conditions: an initial incubation at 72°C for 5 min, followed by 15 cycles of 95°C for 20 sec, 55°C for 30 sec, and 72°C for 30 sec, with a final extension at 72°C for 5 min. The PCR product was purified using Ampure XP beads. Sequencing was performed on the Illumina NovaSeq platform at Novogene.
PCL-seq protocol for FFPE tissue sections
E15.5 mouse embryo FFPE sections (10 µm) were deparaffinized by immersion in the following reagents: xylene for 15 min twice, EtOH 99% for 2 min twice, EtOH 96% for 2 min twice, EtOH 70% for 2 min twice, and H2O for 5 min. Then, a collagenase mix containing 1% BSA and 50 U/µL collagenase I (Gibco, 17100017) was added and incubated for 20 min at 37°C. After incubation, the collagenase mix was washed off with 0.1× SSC buffer. Subsequently, TE buffer (pH 8.0) was added, and the slides were incubated for 1 h at 70°C. After incubation, the slides were equilibrated to room temperature for 5 min. Meanwhile, a 0.1% pepsin solution dissolved in 0.1 M HCl was equilibrated to 37°C. After washing the slides with 0.1× SSC buffer, permeabilization was carried out by adding the pepsin solution and incubating at 37°C for 30 min. The slides were then washed with 0.1× SSC buffer to remove the pepsin solution. The subsequent steps were identical to those used for formaldehyde-fixed tissue sections. After preprocessing the FFPE tissue sections, the remaining protocol followed the same steps as for frozen sections.
Data analysis
Library screening and analysis workflow
The CellCosmo 1.0.11 software's RNA barcode module was utilized to filter and process reads conforming to the library structure. Subsequently, these reads underwent standard analysis using the Drop-seq software. The overall workflow included the following steps:
Barcode splitting (TagBamWithReadSequenceExtended module);
Filtering low-quality sequences (Poly(A)Trimmer module);
Reference genome alignment (using STAR software);
Quantification of reads to exon+intron (TagReadWithGeneFunction module);
Barcode correction based on UMI counts (DetectBeadSynthesisErrors module);
Generation of barcode-gene expression matrix (DigitalExpression module).
Proportion analysis of human and mouse genic reads
The upstream processing employed CellCosmo's RNA barcode module and Drop-seq's standard workflow, with a modification in the reference genome. Specifically, a combined reference genome of human and mouse was constructed, with gene names and chromosome identifiers prefixed by “hg38_” for human and “mm10_” for mouse. Before generating the barcode-gene expression matrix, the BAM file was split into separate human and mouse files using the FilterBam module, based on chromosome prefixes “hg38_” and “mm10_”. These separate BAM files were then processed using the DigitalExpression module to produce two single-cell gene expression matrices: one for human and one for mouse. Subsequently, proportion analysis of genic reads was conducted independently for human and mouse.
Differential gene expression analysis
Statistical analysis was conducted on the normalized gene expression matrix using the differential expression analysis tool DESeq2. Differentially expressed genes were identified based on the following criteria: |Log2(fold change)| > 1 and adjusted P-value < 0.05.
Differential gene expression analysis was conducted using the DESeq2 package in R.
Volcano plot was created with the ggplot2 package.
Principal component analysis was performed using the Gmodels and FactoMineR packages. Notably, the ellipses in the PCA plot were calculated based on the mean and covariance matrix of the sample points, under the assumption that the sample points follow a multivariate normal distribution.
Deconvolution analysis
To determine the contribution of nuclear and cytoplasmic components in the PCL-seq samples, we performed a deconvolution analysis based on reference nuclear and cytoplasmic gene expression profiles (representing the transcriptomes of physically separated HeLa cell nuclear and cytoplasmic samples). First, batch effects between two data sets were removed using Combat with FPKM input, separately addressing batch effects in the nuclear and cytoplasmic components of each data set. Notably, differential gene expression analysis was not conducted prior to batch correction to avoid algorithm-induced instability, which could artificially reduce the observed nuclear-cytoplasmic differences. For example, methods such as DESeq2 may result in only a few hundred genes identified as differentially expressed when batch effects are corrected.
To perform deconvolution, the reference nuclear and cytoplasmic transcriptome data set (hereafter referred to as the “reference data set”) was used to computationally decompose the PCL-seq nuclear and cytoplasmic transcriptome data set (hereafter referred to as the “PCL-seq data set”). Assuming that each mixed sample in the PCL-seq data set can be represented as a linear combination of nuclear and cytoplasmic components, we established the following equation: Mixed sample = w1 × Reference Nuclear + w2 × Reference Cytoplasmic, where w1 and w2 represent the respective contributions of the nuclear and cytoplasmic components to each PCL-seq sample. Using this model, we calculated the contribution proportions for each sample in the PCL-seq data set, providing insights into the nuclear and cytoplasmic fractions represented in the data.
Data access
All raw and processed sequencing data generated in this study have been submitted to the NCBI Gene Expression Omnibus (GEO; https://www.ncbi.nlm.nih.gov/geo/) under accession number GSE292893. Source data are provided as Supplemental Data.
Competing interest statement
A patent application (PCT/CN2022/097049) covering the PCL-seq methodology described in this paper has been filed by Ocean University of China. The authors declare no other competing financial interests.
Acknowledgments
This work is supported by the Funding Project of National Key Research and Development Program of China (2018YFD0900604) and National Natural Science Foundation of China (41676119 and 41476120) to W.S.
Author contributions: W.S. conceived the project. X.D. and W.S. designed the experiment. X.D., M.H., X.C., and W.Z. performed the experiment. J.C. and G.M. performed bioinformatic analysis. X.D. and W.S. wrote the manuscript.
Notes
[1] Supplementary material [Supplemental material is available for this article.]
[2] Article published online before print. Article, supplemental material, and publication date are at https://www.genome.org/cgi/doi/10.1101/gr.279906.124.
References
- ↵Bai Z, Zhang D, Gao Y, Tao B, Zhang D, Bao S, Enninful A, Wang Y, Li H, Su G, 2024. Spatially exploring RNA biology in archival formalin-fixed paraffin-embedded tissues. Cell 187: 6760–6779.e24. 10.1016/j.cell.2024.09.001
- ↵Buenrostro JD, Giresi PG, Zaba LC, Chang HY, Greenleaf WJ. 2013. Transposition of native chromatin for fast and sensitive epigenomic profiling of open chromatin, DNA-binding proteins and nucleosome position. Nat Methods 10: 1213–1218. 10.1038/nmeth.2688
- ↵Chen KH, Boettiger AN, Moffitt JR, Wang S, Zhuang X. 2015. RNA imaging. Spatially resolved, highly multiplexed RNA profiling in single cells. Science 348: aaa6090. 10.1126/science.aaa6090
- ↵Chen A, Liao S, Cheng M, Ma K, Wu L, Lai Y, Qiu X, Yang J, Xu J, Hao S, 2022. Spatiotemporal transcriptomic atlas of mouse organogenesis using DNA nanoball-patterned arrays. Cell 185: 1777–1792.e21. 10.1016/j.cell.2022.04.003
- ↵Cui X, Dong X, Hu M, Zhou W, Shi W. 2024. Large field of view and spatial region of interest transcriptomics in fixed tissue. Commun Biol 7: 1020. 10.1038/s42003-024-06694-5
- ↵Das S, Vera M, Gandin V, Singer RH, Tutucci E. 2021. Intracellular mRNA transport and localized translation. Nat Rev Mol Cell Biol 22: 483–504. 10.1038/s41580-021-00356-8
- ↵Delile J, Rayon T, Melchionda M, Edwards A, Briscoe J, Sagner A. 2019. Single cell transcriptomics reveals spatial and temporal dynamics of gene expression in the developing mouse spinal cord. Development 146: 173807. 10.1242/dev.173807
- ↵Eng CL, Lawson M, Zhu Q, Dries R, Koulena N, Takei Y, Yun J, Cronin C, Karp C, Yuan GC, 2019. Transcriptome-scale super-resolved imaging in tissues by RNA seqFISH. Nature 568: 235–239. 10.1038/s41586-019-1049-y
- ↵Fassunke J, Haller F, Hebele S, Moskalev EA, Penzel R, Pfarr N, Merkelbach-Bruse S, Endris V. 2015. Utility of different massive parallel sequencing platforms for mutation profiling in clinical samples and identification of pitfalls using FFPE tissue. Int J Mol Med 36: 1233–1243. 10.3892/ijmm.2015.2339
- ↵Genshaft AS, Ziegler CGK, Tzouanas CN, Mead BE, Jaeger AM, Navia AW, King RP, Mana MD, Huang S, Mitsialis V, 2021. Live cell tagging tracking and isolation for spatial transcriptomics using photoactivatable cell dyes. Nat Commun 12: 4995. 10.1038/s41467-021-25279-y
- ↵Gong M, Wang Z, Liu Y, Li W, Ye S, Zhu J, Zhang H, Wang J, He K. 2020. A transcriptomic analysis of Nsmce1 overexpression in mouse hippocampal neuronal cell by RNA sequencing. Funct Integr Genomics 20: 459–470. 10.1007/s10142-019-00728-6
- ↵Gracia Villacampa E, Larsson L, Mirzazadeh R, Kvastad L, Andersson A, Mollbrink A, Kokaraki G, Monteil V, Schultz N, Appelberg KS, 2021. Genome-wide spatial expression profiling in formalin-fixed tissues. Cell Genom 1: 100065. 10.1016/j.xgen.2021.100065
- ↵Heavner W, Pevny L. 2012. Eye development and retinogenesis. Cold Spring Harb Perspect Biol 4: a008391. 10.1101/cshperspect.a008391
- ↵Hildebrandt F, Andersson A, Saarenpää S, Larsson L, Van Hul N, Kanatani S, Masek J, Ellis E, Barragan A, Mollbrink A, 2021. Spatial transcriptomics to define transcriptional patterns of zonation and structural components in the mouse liver. Nat Commun 12: 746. 10.1038/s41467-021-27354-w
- ↵Hoffman EA, Frey BL, Smith LM, Auble DT. 2015. Formaldehyde crosslinking: a tool for the study of chromatin complexes. J Biol Chem 290: 26404–26411. 10.1074/jbc.R115.651679
- ↵Holoch D, Moazed D. 2015. RNA-mediated epigenetic regulation of gene expression. Nat Rev Genet 16: 71–84. 10.1038/nrg3863
- ↵Honda M, Oki S, Kimura R, Harada A, Maehara K, Tanaka K, Meno C, Ohkawa Y. 2021. High-depth spatial transcriptome analysis by photo-isolation chemistry. Nat Commun 12: 4416. 10.1038/s41467-021-24691-8
- ↵Hu KH, Eichorst JP, McGinnis CS, Patterson DM, Chow ED, Kersten K, Jameson SC, Gartner ZJ, Rao AA, Krummel MF. 2020. ZipSeq: barcoding for real-time mapping of single cell transcriptomes. Nat Methods 17: 833–843. 10.1038/s41592-020-0880-2
- ↵Hwang WL, Jagadeesh KA, Guo JA, Hoffman HI, Yadollahpour P, Reeves JW, Mohan R, Drokhlyansky E, Van Wittenberghe N, Ashenberg O, 2022. Single-nucleus and spatial transcriptome profiling of pancreatic cancer identifies multicellular dynamics associated with neoadjuvant treatment. Nat Genet 54: 1178–1191. 10.1038/s41588-022-01134-8
- ↵Karia B, Martinez JA, Bishop AJ. 2013. Induction of homologous recombination following in utero exposure to DNA-damaging agents. DNA Repair (Amst) 12: 912–921. 10.1016/j.dnarep.2013.08.005
- ↵Kaya-Okur HS, Wu SJ, Codomo CA, Pledger ES, Bryson TD, Henikoff JG, Ahmad K, Henikoff S. 2019. CUT&Tag for efficient epigenomic profiling of small samples and single cells. Nat Commun 10: 1930. 10.1038/s41467-019-09982-5
- ↵Kishi JY, Liu N, West ER, Sheng K, Jordanides JJ, Serrata M, Cepko CL, Saka SK, Yin P. 2022. Light-Seq: light-directed in situ barcoding of biomolecules in fixed cells and tissues for spatially indexed sequencing. Nat Methods 19: 1393–1402. 10.1038/s41592-022-01604-1
- ↵Liu Y, Yang M, Deng Y, Su G, Enninful A, Guo CC, Tebaldi T, Zhang D, Kim D, Bai Z, 2020. High-spatial-resolution multi-omics sequencing via deterministic barcoding in tissue. Cell 183: 1665–1681.e18. 10.1016/j.cell.2020.10.026
- ↵Liu Y, Wu Z, Feng Y, Gao J, Wang B, Lian C, Diao B. 2023. Integration analysis of single-cell and spatial transcriptomics reveal the cellular heterogeneity landscape in glioblastoma and establish a polygenic risk model. Front Oncol 13: 1109037. 10.3389/fonc.2023.1109037
- ↵Llorens-Bobadilla E, Zamboni M, Marklund M, Bhalla N, Chen X, Hartman J, Frisén J, Ståhl PL. 2023. Solid-phase capture and profiling of open chromatin by spatial ATAC. Nat Biotechnol 41: 1085–1088. 10.1038/s41587-022-01603-9
- ↵Love MI, Huber W, Anders S. 2014. Moderated estimation of fold change and dispersion for RNA-seq data with DESeq2. Genome Biol 15: 550. 10.1186/s13059-014-0550-8
- ↵Mangiameli SM, Chen H, Earl AS, Dobkin JA, Lesman D, Buenrostro JD, Chen F. 2023. Photoselective sequencing: microscopically guided genomic measurements with subcellular resolution. Nat Methods 20: 686–694. 10.1038/s41592-023-01845-8
- ↵Melo Ferreira R, Sabo AR, Winfree S, Collins KS, Janosevic D, Gulbronson CJ, Cheng YH, Casbon L, Barwinska D, Ferkowicz MJ, 2021. Integration of spatial and single-cell transcriptomics localizes epithelial cell-immune cross-talk in kidney injury. JCI Insight 6: 147703. 10.1172/jci.insight.147703
- ↵Merritt CR, Ong GT, Church SE, Barker K, Danaher P, Geiss G, Hoang M, Jung J, Liang Y, McKay-Fleisch J, 2020. Multiplex digital spatial profiling of proteins and RNA in fixed tissue. Nat Biotechnol 38: 586–599. 10.1038/s41587-020-0472-9
- ↵Moncada R, Barkley D, Wagner F, Chiodin M, Devlin JC, Baron M, Hajdu CH, Simeone DM, Yanai I. 2020. Integrating microarray-based spatial transcriptomics and single-cell RNA-seq reveals tissue architecture in pancreatic ductal adenocarcinomas. Nat Biotechnol 38: 333–342. 10.1038/s41587-019-0392-8
- ↵Moses L, Pachter L. 2022. Museum of spatial transcriptomics. Nat Methods 19: 534–546. 10.1038/s41592-022-01409-2
- ↵Nichterwitz S, Chen G, Aguila Benitez J, Yilmaz M, Storvall H, Cao M, Sandberg R, Deng Q, Hedlund E. 2016. Laser capture microscopy coupled with Smart-seq2 for precise spatial transcriptomic profiling. Nat Commun 7: 12139. 10.1038/ncomms12139
- ↵Olejnik J, Krzymanska-Olejnik E, Rothschild KJ. 1998. Photocleavable aminotag phosphoramidites for 5′-termini DNA/RNA labeling. Nucleic Acids Res 26: 3572–3576. 10.1093/nar/26.15.3572
- ↵Peixoto P, Cartron PF, Serandour AA, Hervouet E. 2020. From 1957 to nowadays: a brief history of epigenetics. Int J Mol Sci 21: 7571. 10.3390/ijms21207571
- ↵Rahman S, Zenklusen D. 2013. Single-molecule resolution fluorescent in situ hybridization (smFISH) in the yeast S. cerevisiae. Methods Mol Biol 1042: 33–46. 10.1007/978-1-62703-526-2_3
- ↵Rodriques SG, Stickels RR, Goeva A, Martin CA, Murray E, Vanderburg CR, Welch J, Chen LM, Chen F, Macosko EZ. 2019. Slide-seq: a scalable technology for measuring genome-wide expression at high spatial resolution. Science 363: 1463–1467. 10.1126/science.aaw1219
- ↵Russell AJC, Weir JA, Nadaf NM, Shabet M, Kumar V, Kambhampati S, Raichur R, Marrero GJ, Liu S, Balderrama KS, 2024. Slide-tags enables single-nucleus barcoding for multimodal spatial genomics. Nature 625: 101–109. 10.1038/s41586-023-06837-4
- ↵Shah S, Lubeck E, Zhou W, Cai L. 2016. In situ transcription profiling of single cells reveals spatial organization of cells in the mouse hippocampus. Neuron 92: 342–357. 10.1016/j.neuron.2016.10.001
- ↵Shears SB, Baughman BM, Gu C, Nair VS, Wang H. 2017. The significance of the 1-kinase/1-phosphatase activities of the PPIP5K family. Adv Biol Regul 63: 98–106. 10.1016/j.jbior.2016.10.003
- ↵Shiau C, Cao J, Gregory MT, Gong D, Yin X, Cho JW, Wang PL, Su J, Wang S, Reeves JW, 2023. Therapy-associated remodeling of pancreatic cancer revealed by single-cell spatial transcriptomics and optimal transport analysis. bioRxiv 10.1101/2023.06.28.546848
- ↵Smith AN, Miller LA, Radice G, Ashery-Padan R, Lang RA. 2009. Stage-dependent modes of Pax6-Sox2 epistasis regulate lens development and eye morphogenesis. Development 136: 2977–2985. 10.1242/dev.037341
- ↵Srivatsan SR, Regier MC, Barkan E, Franks JM, Packer JS, Grosjean P, Duran M, Saxton S, Ladd JJ, Spielmann M, 2021. Embryo-scale, single-cell spatial transcriptomics. Science 373: 111–117. 10.1126/science.abb9536
- ↵Ståhl PL, Salmén F, Vickovic S, Lundmark A, Navarro JF, Magnusson J, Giacomello S, Asp M, Westholm JO, Huss M, 2016. Visualization and analysis of gene expression in tissue sections by spatial transcriptomics. Science 353: 78–82. 10.1126/science.aaf2403
- ↵Stickels RR, Murray E, Kumar P, Li J, Marshall JL, Di Bella DJ, Arlotta P, Macosko EZ, Chen F. 2021. Highly sensitive spatial transcriptomics at near-cellular resolution with Slide-seqV2. Nat Biotechnol 39: 313–319. 10.1038/s41587-020-0739-1
- ↵Stoeckius M, Hafemeister C, Stephenson W, Houck-Loomis B, Chattopadhyay PK, Swerdlow H, Satija R, Smibert P. 2017. Simultaneous epitope and transcriptome measurement in single cells. Nat Methods 14: 865–868. 10.1038/nmeth.4380
- ↵Tavares-Ferreira D, Shiers S, Ray PR, Wangzhou A, Jeevakumar V, Sankaranarayanan I, Cervantes AM, Reese JC, Chamessian A, Copits BA, 2022. Spatial transcriptomics of dorsal root ganglia identifies molecular signatures of human nociceptors. Sci Transl Med 14: 16. 10.1126/scitranslmed.abj8186
- ↵Turner-Bridger B, Jakobs M, Muresan L, Wong HH, Franze K, Harris WA, Holt CE. 2018. Single-molecule analysis of endogenous β-actin mRNA trafficking reveals a mechanism for compartmentalized mRNA localization in axons. Proc Natl Acad Sci 115: E9697–E9706. 10.1073/pnas.1806189115
- ↵van den Brink SC, Alemany A, van Batenburg V, Moris N, Blotenburg M, Vivié J, Baillie-Johnson P, Nichols J, Sonnen KF, Martinez Arias A, 2020. Single-cell and spatial transcriptomics reveal somitogenesis in gastruloids. Nature 582: 405–409. 10.1038/s41586-020-2024-3
- ↵Vickovic S, Eraslan G, Salmén F, Klughammer J, Stenbeck L, Schapiro D, Äijö T, Bonneau R, Bergenstråhle L, Navarro JF, 2019. High-definition spatial transcriptomics for in situ tissue profiling. Nat Methods 16: 987–990. 10.1038/s41592-019-0548-y
- ↵Wang NK, Tosi J, Kasanuki JM, Chou CL, Kong J, Parmalee N, Wert KJ, Allikmets R, Lai CC, Chien CL, 2010. Transplantation of reprogrammed embryonic stem cells improves visual function in a mouse model for retinitis pigmentosa. Transplantation 89: 911–919. 10.1097/TP.0b013e3181d45a61
- ↵Wang F, Long J, Li L, Wu ZX, Da TT, Wang XQ, Huang C, Jiang YH, Yao XQ, Ma HQ, 2023. Single-cell and spatial transcriptome analysis reveals the cellular heterogeneity of liver metastatic colorectal cancer. Sci Adv 9: eadf5464. 10.1126/sciadv.adf5464
- ↵Wu P, Grainger DW. 2004. Toward immobilized antibody microarray optimization: print buffer and storage condition comparisons on performance. Biomed Sci Instrum 40: 243–248.