
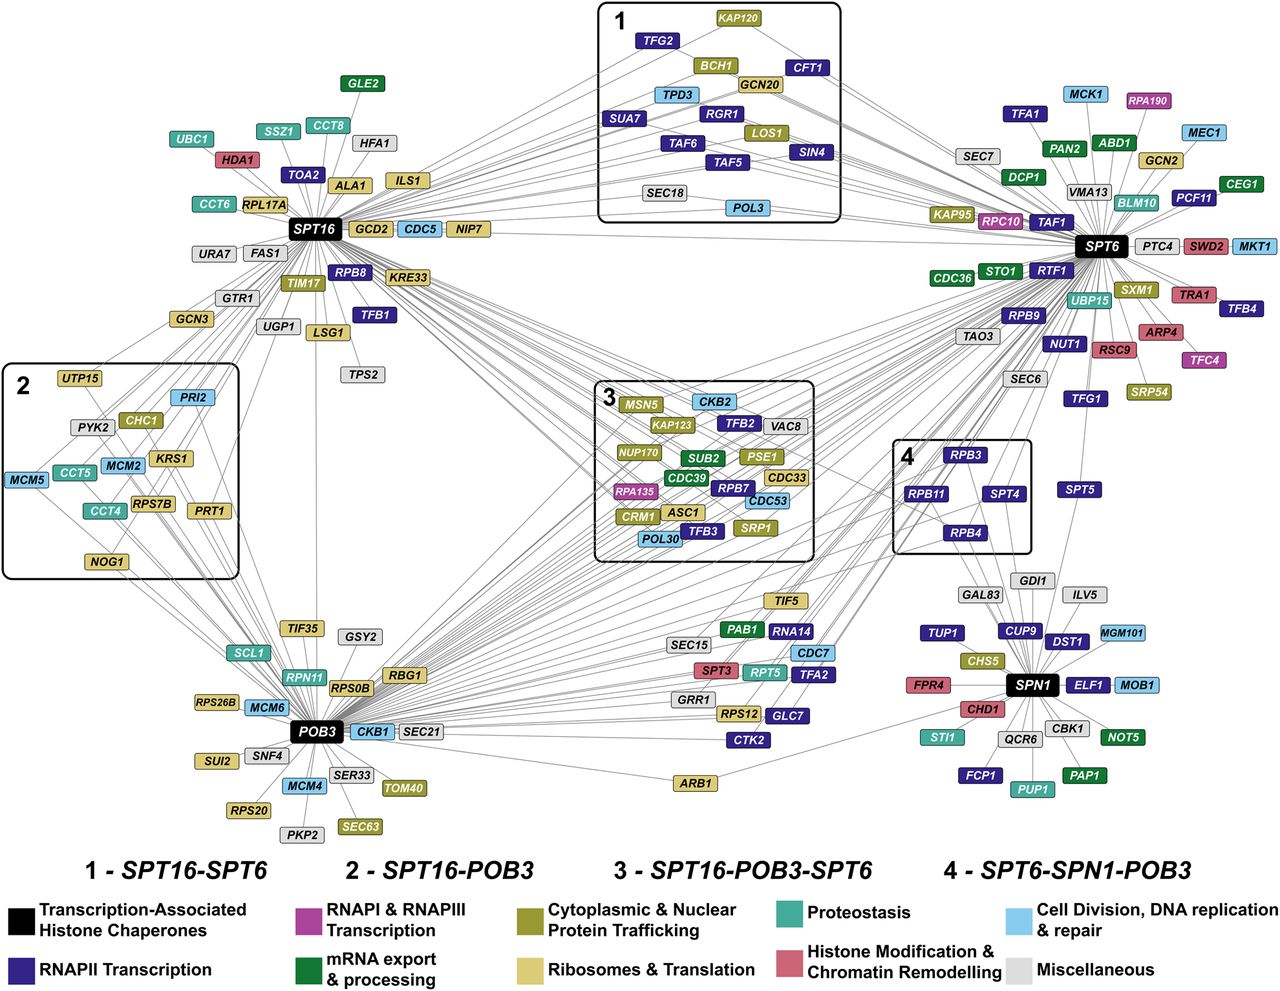
ERC network of transcription-associated histone chaperones identifies both known and putative functional interactions. Each node in the network is a gene, and an edge between two nodes indicates that the genes share an ERC value above a Z-score cutoff of three (SPT16, N = 72; POB3, N = 67; SPT6, N = 86; SPN1, N = 25). The ERC values in this network range from 6.94 to 16.01. Clusters in boxes represent nodes that are connected to two or more of the queried histone chaperones. The colors of the nodes represent the biological process associated with the gene. Biological process associations were manually curated from the Saccharomyces Genome Database. The miscellaneous category consists of genes involved in autophagy (GTR1), budding (CBK1 and TAO3), metabolism (FAS1, GAL83, GRR1, GSY2, HFA1, ILV5, PKP2, PYK2, QCR6, SER33, SNF4, TPS2, UGP1, and URA7), vesicular transport (GDI1, SEC15, SEC18, SEC21, SEC6, and SEC7), vacuole acidification (VMA13), and vacuole fusion (VAC8).


