
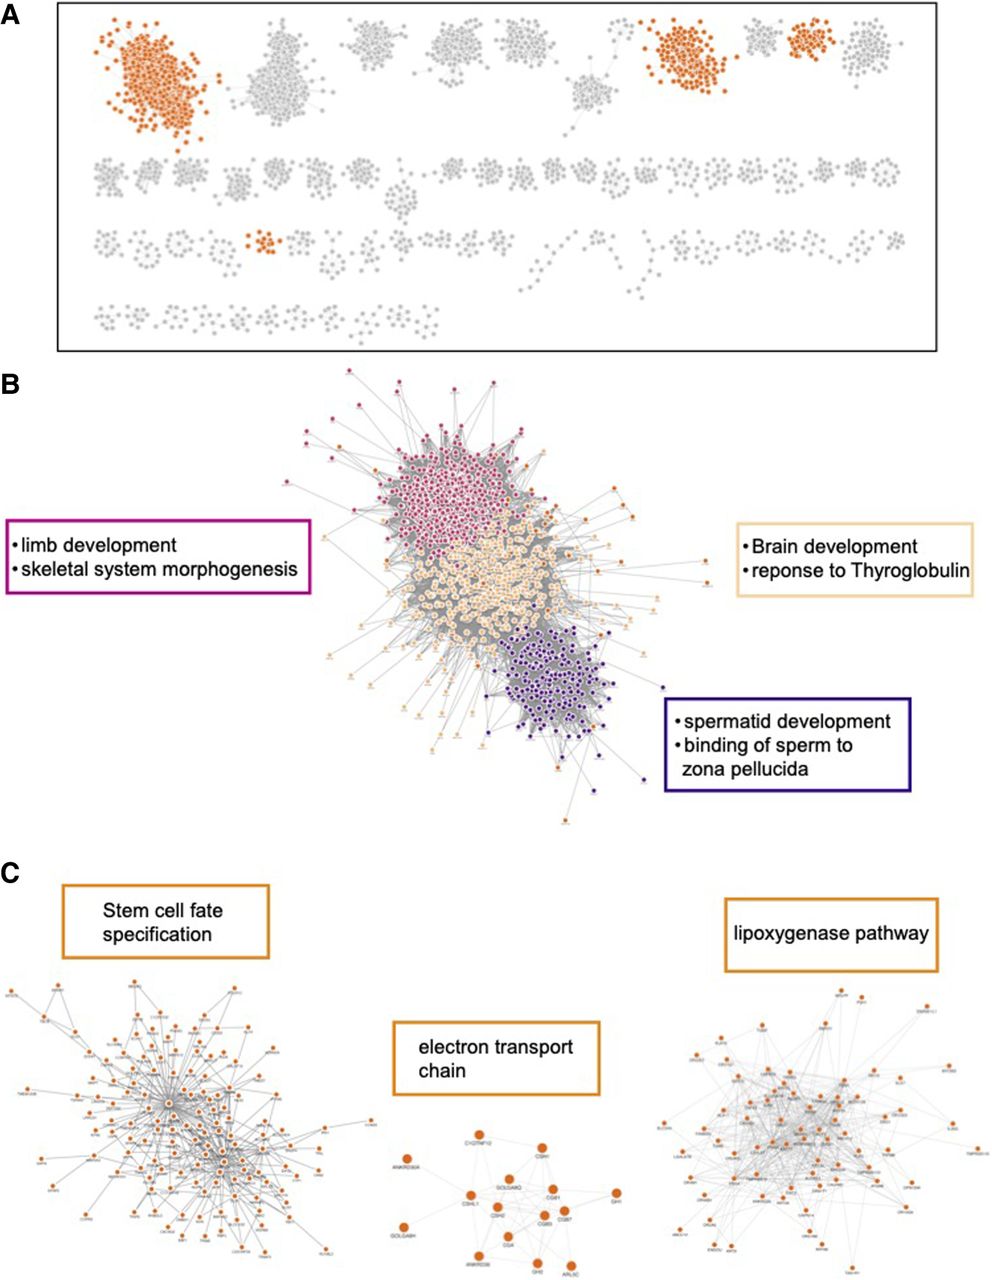
Figure 6.
Mammal ERC captures organismal processes. Cytoscape MCL clusters using the top 500,000 mammal FtERC values as the weights. (A) Clusters with 10 or more members; all network clusters can be found in Supplemental Figure S6. Clusters highlighted in B and C are highlighted in orange. (B) Enlarged image of MCL cluster 1. The large cluster is colored by subclusters with the highest enriched GO-BP term listed next to the subcluster in the corresponding color. (C) Select clusters with the highest enriched GO-BP term shown on top of the cluster. The full enrichment lists are in Supplemental File 3.


