
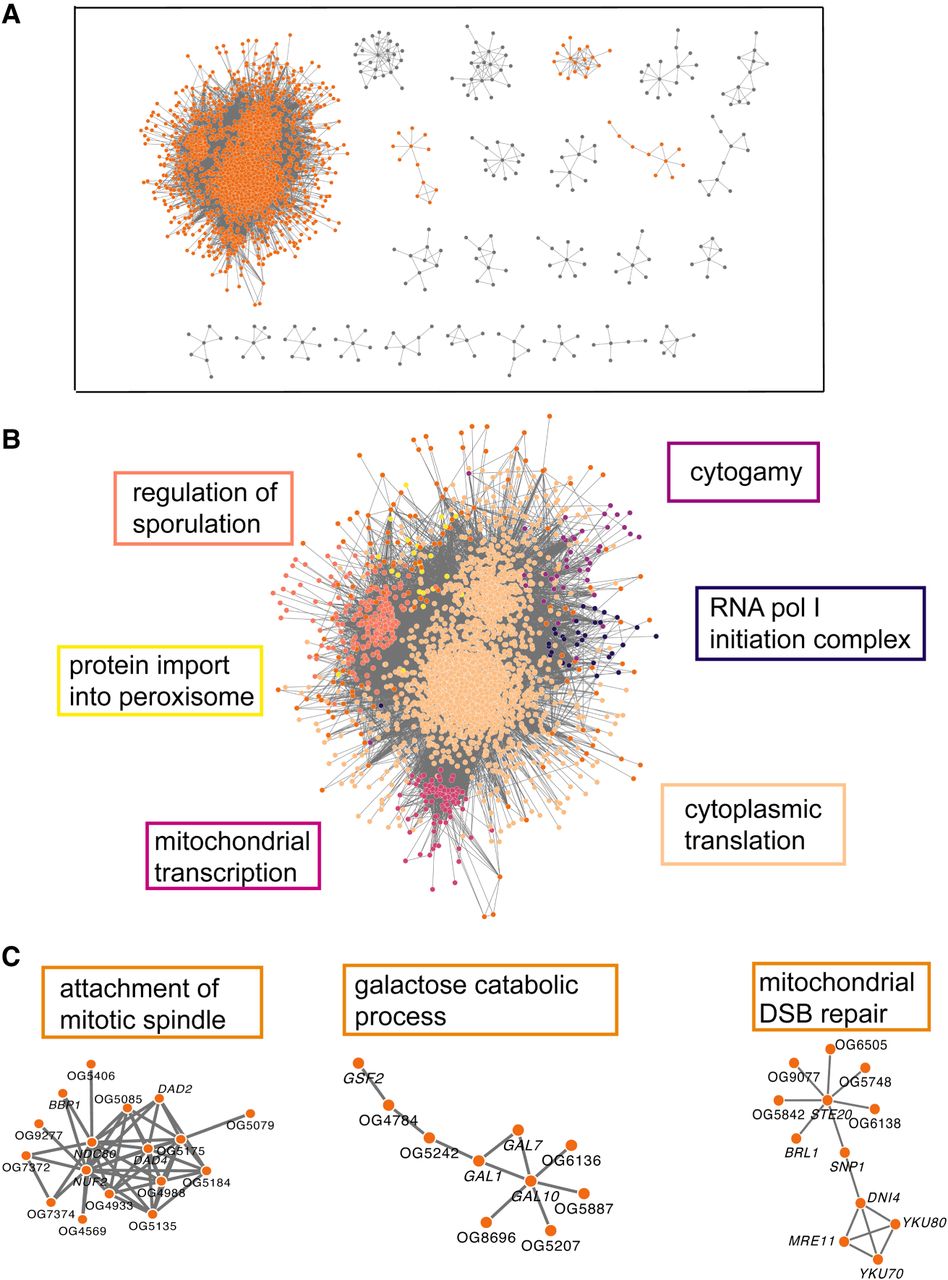
Figure 5.
Yeast ERC is largely dominated by transcription/translation related processes. Cytoscape MCL clusters using the top 500,000 yeast FtERC values as the weights. (A) MCL clusters with more than six members; clusters highlighted in B and C are displayed in orange. A full network of all clusters is pictured in Supplemental Figure S5. (B) Enlarged image of MCL cluster 1. The large cluster is colored by subclusters with the highest enriched GO-BP term listed next to the subcluster in the corresponding color. (C) Select clusters with the highest enriched GO-BP term is shown on top of the cluster. (DSB) Double-stranded break. The full enrichment lists are in Supplemental File 2.


