
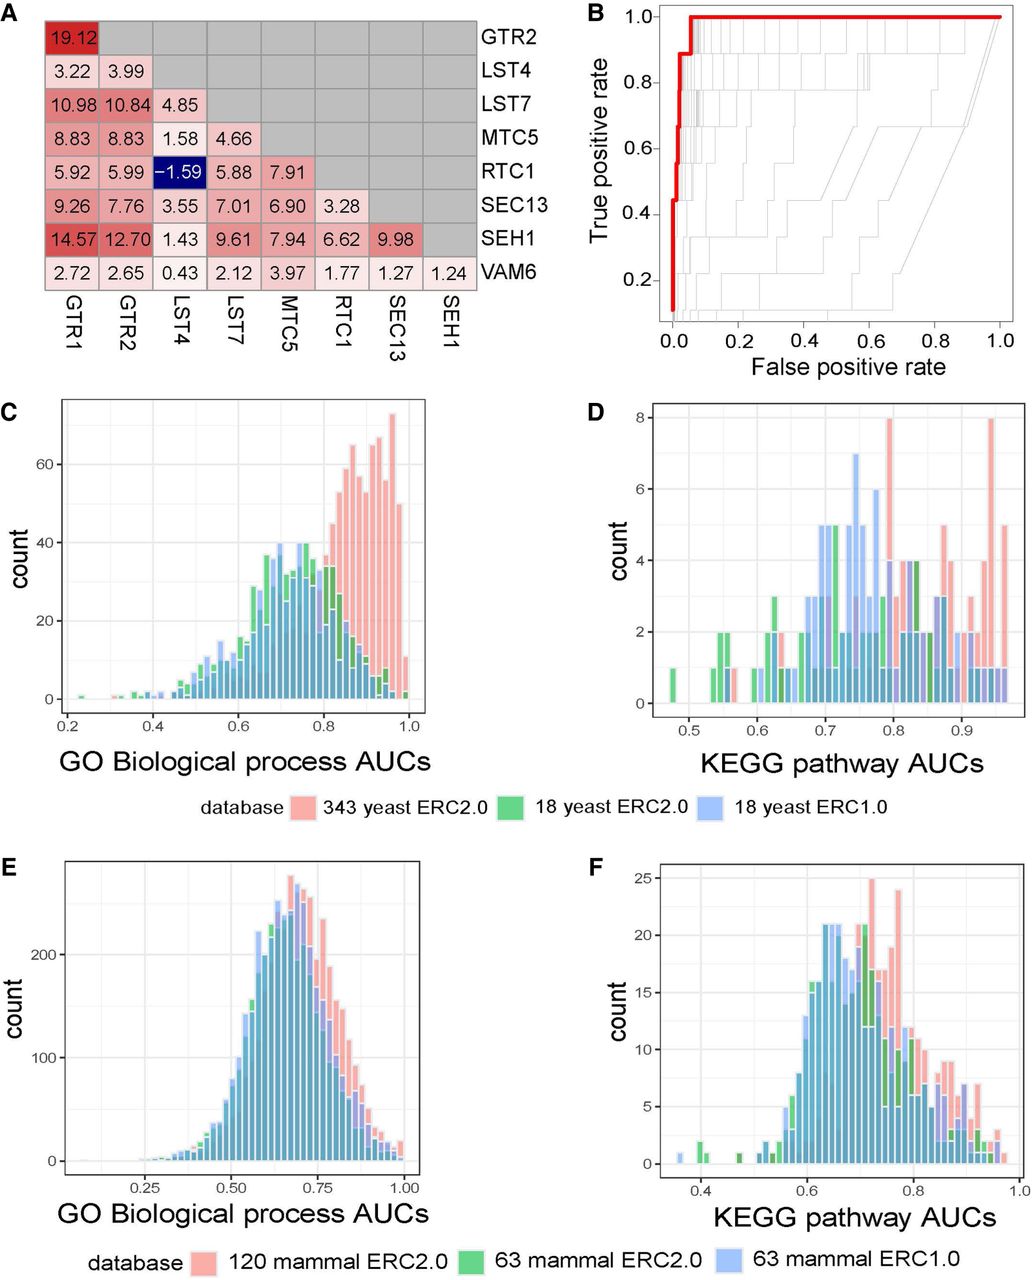
ERC2.0 improves predictive potential for GO biological processes (GO-BP) and KEGG pathways. (A) Pairwise yeast ERC scores for members of the biological process pathway, “positive regulation of TORC1.” Red colors indicate a higher FtERC; blue indicates a lower FtERC. (B) ROC curves for each model generated with cv.glmnet for “positive regulation of TORC1.” The red line indicates the model with the highest ROC-AUC of 0.988. (C,D) cv.glmnet validation of GO biological processes (C; n = 545), and KEGG pathways (D; n = 49) using ERC2.0 on 343 yeast species (red), ERC2.0 on 18 yeast (green), and ERC1.0 on 18 yeast (blue). There is a significant difference in means between 343 yeast ERC2.0 and both 18 yeast ERC2.0 and ERC1.0 for both GO-BP (P < 2.2 × 10⁻¹⁶, P < 2.2 × 10⁻¹⁶, respectively) and KEGG pathways (P < 2.2 × 10⁻¹⁶, P = 1.089 × 10⁻⁸, respectively). (E,F) cv.glmnet validation of GO biological processes (E; n = 5807) and KEGG pathways (F; n = 320) using ERC2.0 on 120 mammal species (red), ERC2.0 on 63 mammal species (green), and ERC1.0 on 63 mammal species (blue). There is a significant difference in means between 120 mammal ERC2.0 and both 63 mammal ERC2.0 and ERC1.0 for both GO-BP (P < 2.2 × 10⁻¹⁶, P = 1.147 × 10⁻⁵, respectively) and KEGG pathways (P = 1.259 × 10⁻¹⁵, P = 1.486 × 10⁻¹²). Each count is the highest AUC (s = lambda.min) predicted by glmnet.cv.


