
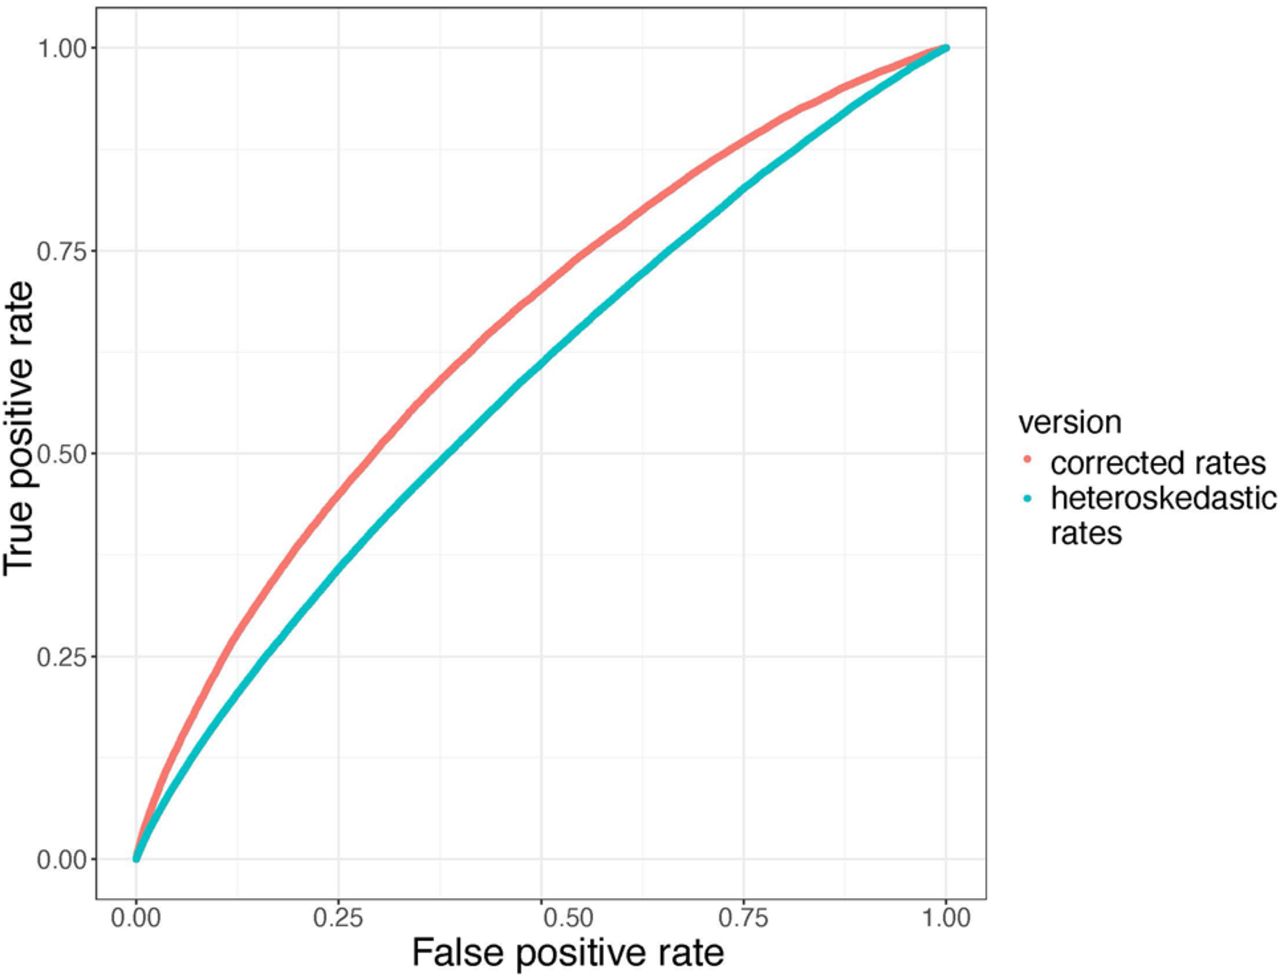
Figure 3.
Removal of heteroskedasticity improves ERC predictive power. Receiver operator characteristic (ROC) curves contrasting true-positive and false-positive rates demonstrate higher power in ERC2.0 values calculated using corrected rates (red curve; AUC = 0.652) compared with ERC1.0 values using uncorrected, heteroskedastic rates (blue curve; AUC = 0.581). The true-positive set are interactions from STRING with combined scores that are more than 700. ERC scores were calculated on a phylogeny of 18 yeast species.


