
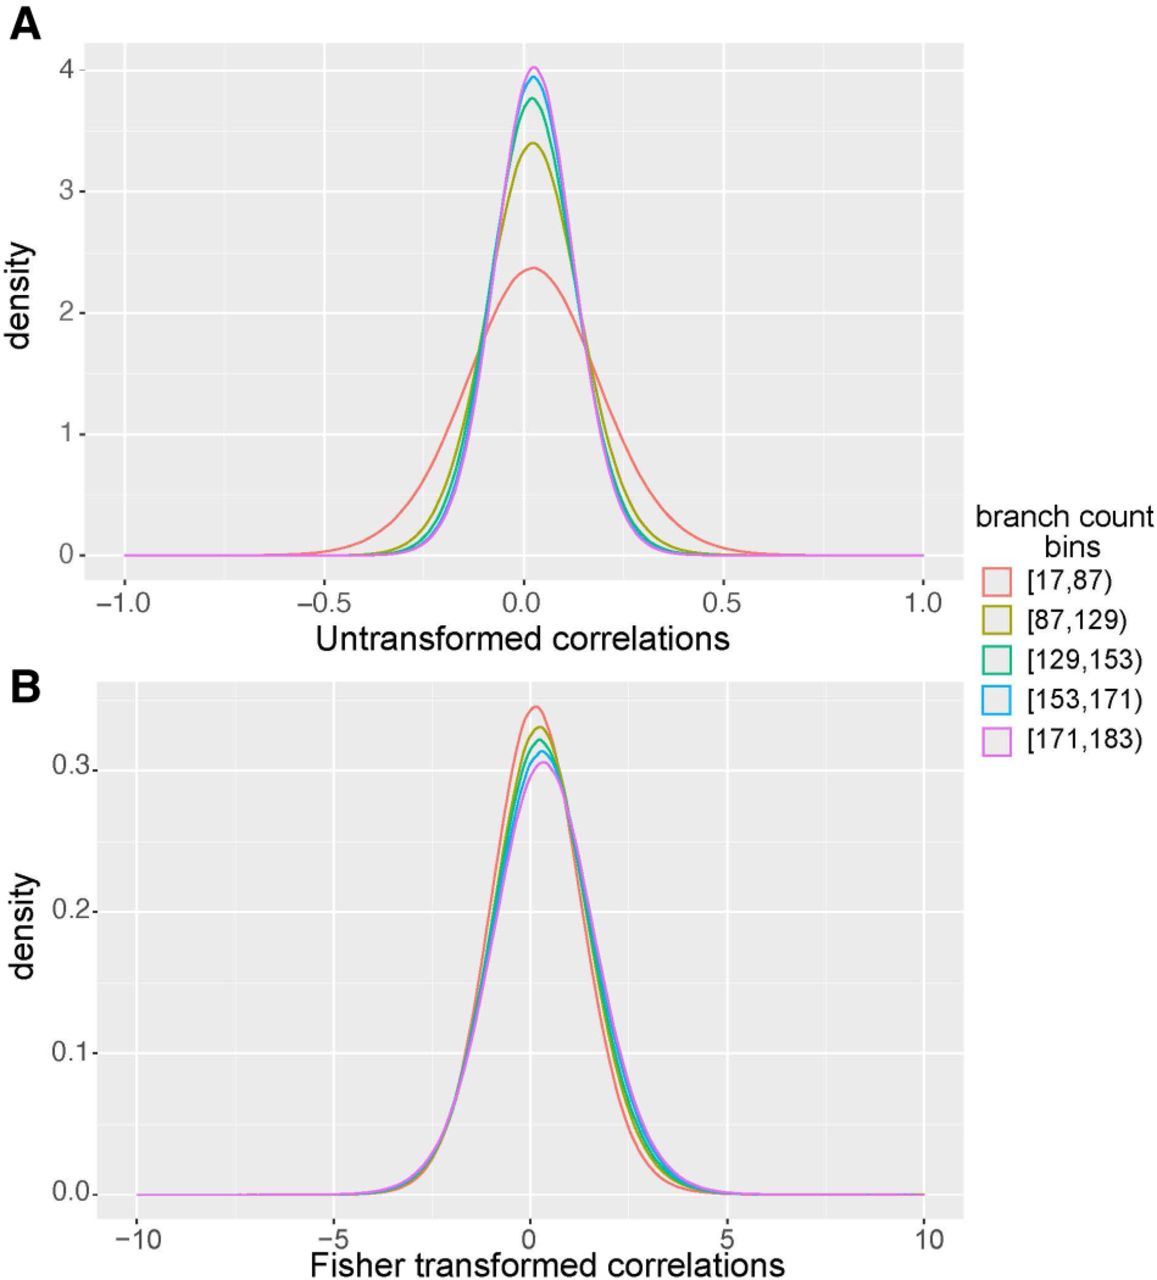
Fisher transformation normalizes variance across 183 million gene pairs with different branch counts. (A) Untransformed Pearson's correlations for gene pairs calculated on 120 mammals. Gene pairs were sorted into equally sized bins based on the number of branches that contributed to the ERC score. (B) Fisher-transformed correlations for gene pairs calculated on 120 mammals. Gene pairs were sorted into equally sized bins based on the number of branches that contributed to the ERC score. This transformation allows scores to be meaningfully compared across taxa. Using Fisher-transformed values results in a more consistent variance and higher predictive power than untransformed correlation coefficients (Supplemental Fig. S2).


