
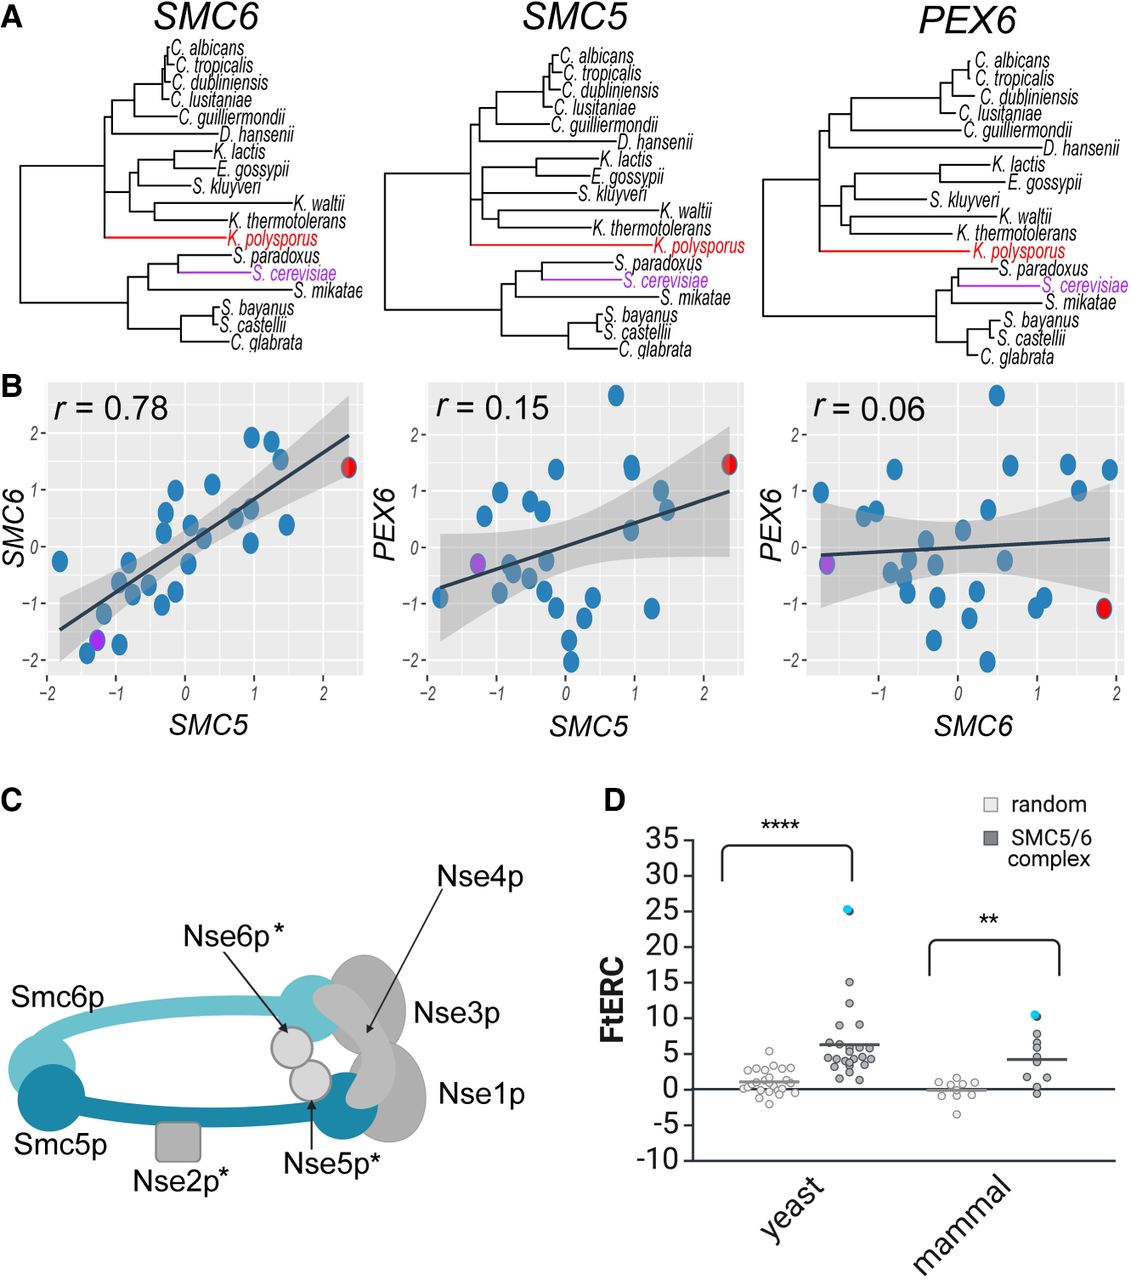
SMC5/6 complex shows significantly elevated ERC in both yeast and mammal phylogenies. (A) Gene trees showing the branch lengths for SMC6, SMC5, and PEX6, respectively, across 18 yeast species. Representative species, S. cerevisiae and K. polysporus, are highlighted in purple and red, respectively, in all three trees. (B) Scatter plots comparing the relative evolutionary rates for SMC6 × SMC5, SMC5 × PEX6, and SMC6 × PEX6 using the same 18 yeast species as shown in A with the representative species, S. cerevisiae and K. polysporus, shown in a purple and red dot, respectively. A linear regression line with 95% confidence interval is shown in black and gray, respectively. The Pearson's correlation for each comparison is shown in the top left corner of the plot. (C) Cartoon schematic of the SMC5/6 complex. An asterisk indicates a yeast-specific complex member. (D) Fisher-transformed ERC (FtERC) values for all pairs within the SMC5/6 complex for a yeast data set of 343 species (left; gray) and mammal data set of 120 species (right; gray) with size-matched random gene pair samples for each data set (white). The data point with the highest FtERC in both data sets is between SMC5 and SMC6 (blue dot). Both data sets had significantly higher ERC—(**) P < 0.001, (****) P < 0.00001—than the sample of randomly selected gene pairs from the entire genome. Panels C and D created in BioRender (Little et al. 2024; https://www.biorender.com).


