
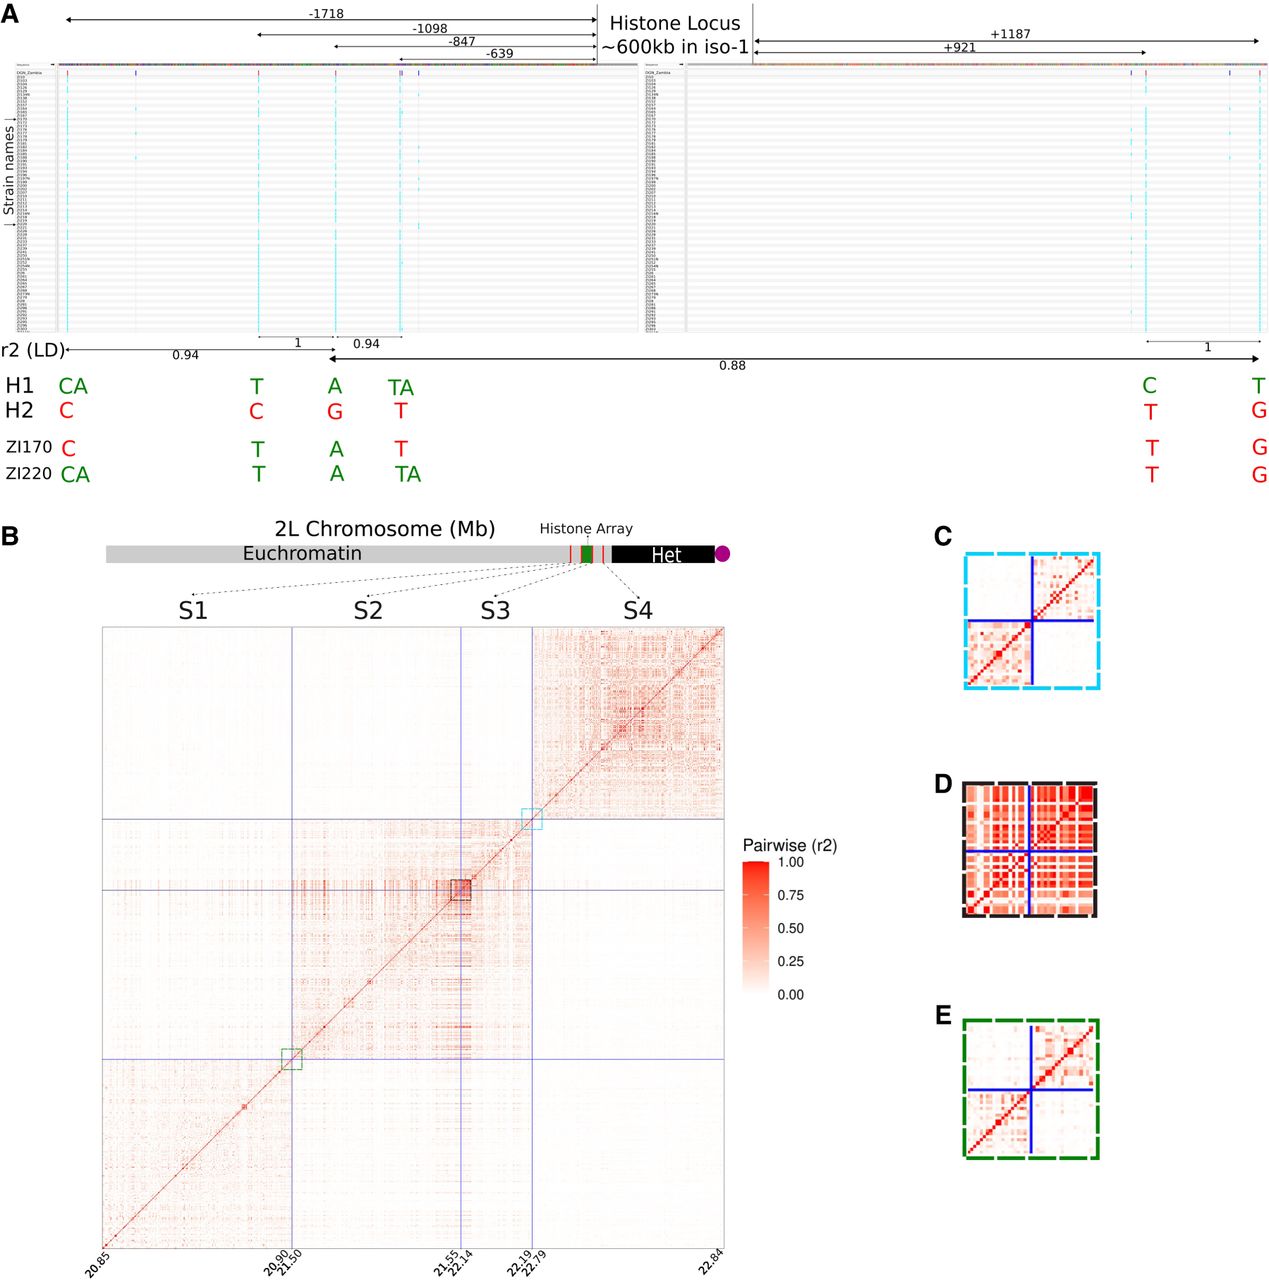
Recombination (crossing-over) in and around the histone locus. (A) Integrative Genomics Viewer plot of the regions flanking the histone locus. Values between double-headed arrows under the x-axis indicate the r2 measure of linkage disequilibrium between the variants spanned by the arrows. Coordinates are with respect to the histone locus, with negative values indicating the distal flank and positive values indicating the proximal flank. H1 and H2 each represent haplotypes present in all but two strains. ZI170 and ZI220 possess their own private combinations of variants from H1 and H2 haplotypes and are the only representatives of their respective haplotypes. (B) Matrix of r2 between 4- and 50-kb segments (S1–S4) around the histone locus. Each segment is fixed in physical size. Because only variants are plotted, the plotted size scales with the number of variants in the segment. Each segment is separated by a size determined by the length of the histone cluster in iso-1 (∼600 kb). Colored boxes correspond to expansions in panels C–E. Bottom: Schematic representation of Chromosome 2L and the location of the histone locus with respect to the segments and to the annotated boundaries of the heterochromatin. (C) Expanded view of pairwise LD for 50-kb regions flanking a control locus spanning 22.19–22.79 Mb (i.e., S3 and S4). (D) Expanded view of pairwise LD for 50-kb regions flanking the histone locus spanning 21.55–22.14 Mb (i.e., S2 and S2). (E) Expanded view of pairwise LD for 50-kb regions flanking a control locus spanning 20.9–21.5 Mb (i.e., S1 and S2).


