
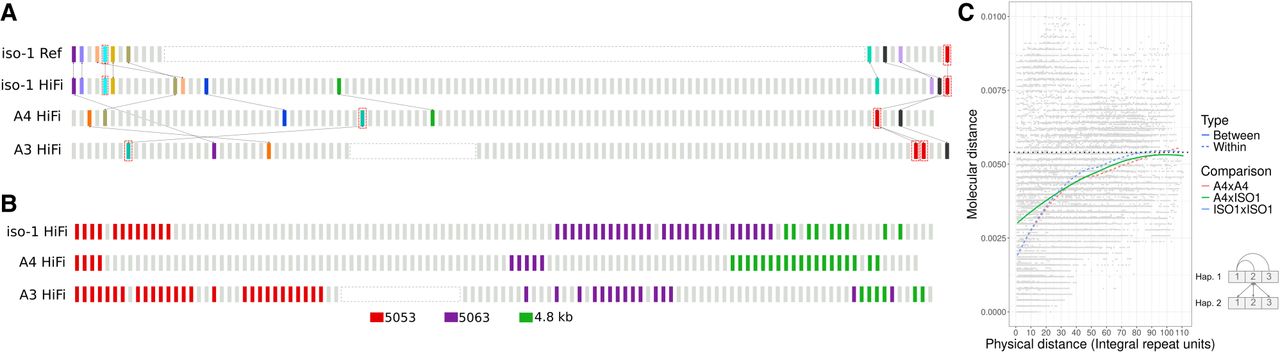
The histone locus is a dynamic array characterized by extensive rearrangements across different D. melanogaster haplotypes. (A) Distribution of landmark anchors used in this study. Anchors enclosed in red boxes indicate units harboring TE insertions. Other anchors are identified by phylogenetic grouping (see Methods). Anchors sharing the same color are putatively homologous. Lines between strains highlight the positions of these putative homologs in their respective haplotypes. (B) Distribution of unit types along the histone cluster in three haplotypes, including two additional subtypes of 5-kb: 5053 and 5063. (C) Graphical representation of physical distance between histone units on the chromosome (x-axis) and molecular distance (y-axis). Molecular distances represent all unique pairwise comparisons either between or within strains. Bottom right: Schematic diagram how molecular distance comparisons between and within strain comparisons were conducted.


