
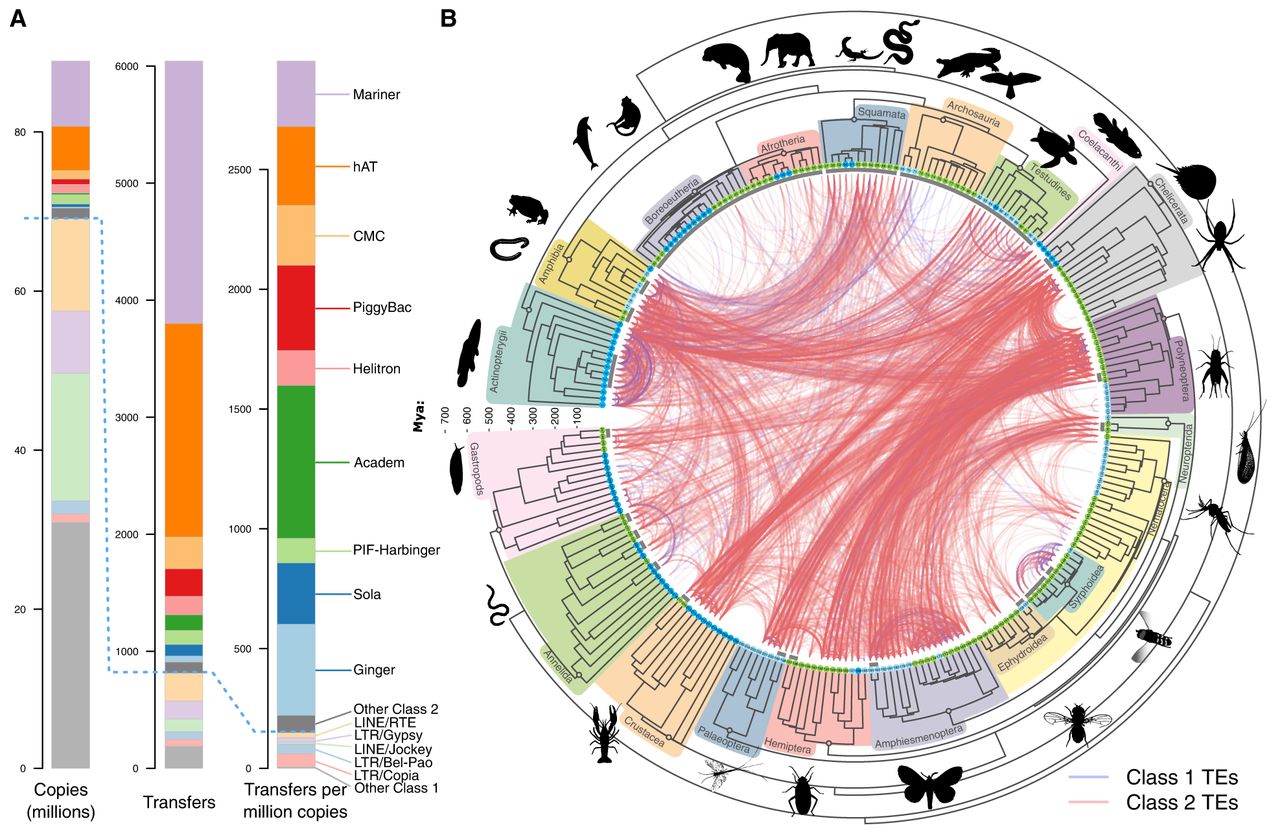
Horizontal transfer of transposable elements in animals. (A) Statistics on TE superfamilies. Bar plots show the total number of copies of each TE superfamily, the total number of independent transfers recovered for each superfamily, and the total number of independent transfers per million copies (see also Supplemental Fig. S3A). Superfamilies above the blue dashed line comprise Class 2 elements (DNA transposons); those below comprise Class 1 elements (retrotransposons). Superfamilies involved in fewer than 50 transfer events are grouped in the “Other” category for each class. (B) Detected horizontal transfer events. The concave time tree represents the phylogeny of the 247 species analyzed (tree in Newick format in Supplemental Dataset S2). Species are numbered on tree tips according to Supplemental Dataset S1. Species living in terrestrial, semiaquatic, or fully aquatic habitat have their numbers circled in green, light blue, and dark blue, respectively. The 19 taxonomic groups are highlighted in different colors (silhouettes of representative species were obtained from PhyloPic.org and cleanpng.com). Concave gray lines at the branch tips encompass “species units” within which HTT was not studied (due to the difficulty of distinguishing HTT from vertical inheritance of TEs; see Supplemental Methods; Supplemental Fig. S2A). Each curve represents one of the 6043 independent HTT events recovered and connects the two species involved in the hit of the highest sequence identity in the transfer. Blue curves represent HTT of Class 1 TEs and red curves HTT of Class 2 TEs.


