
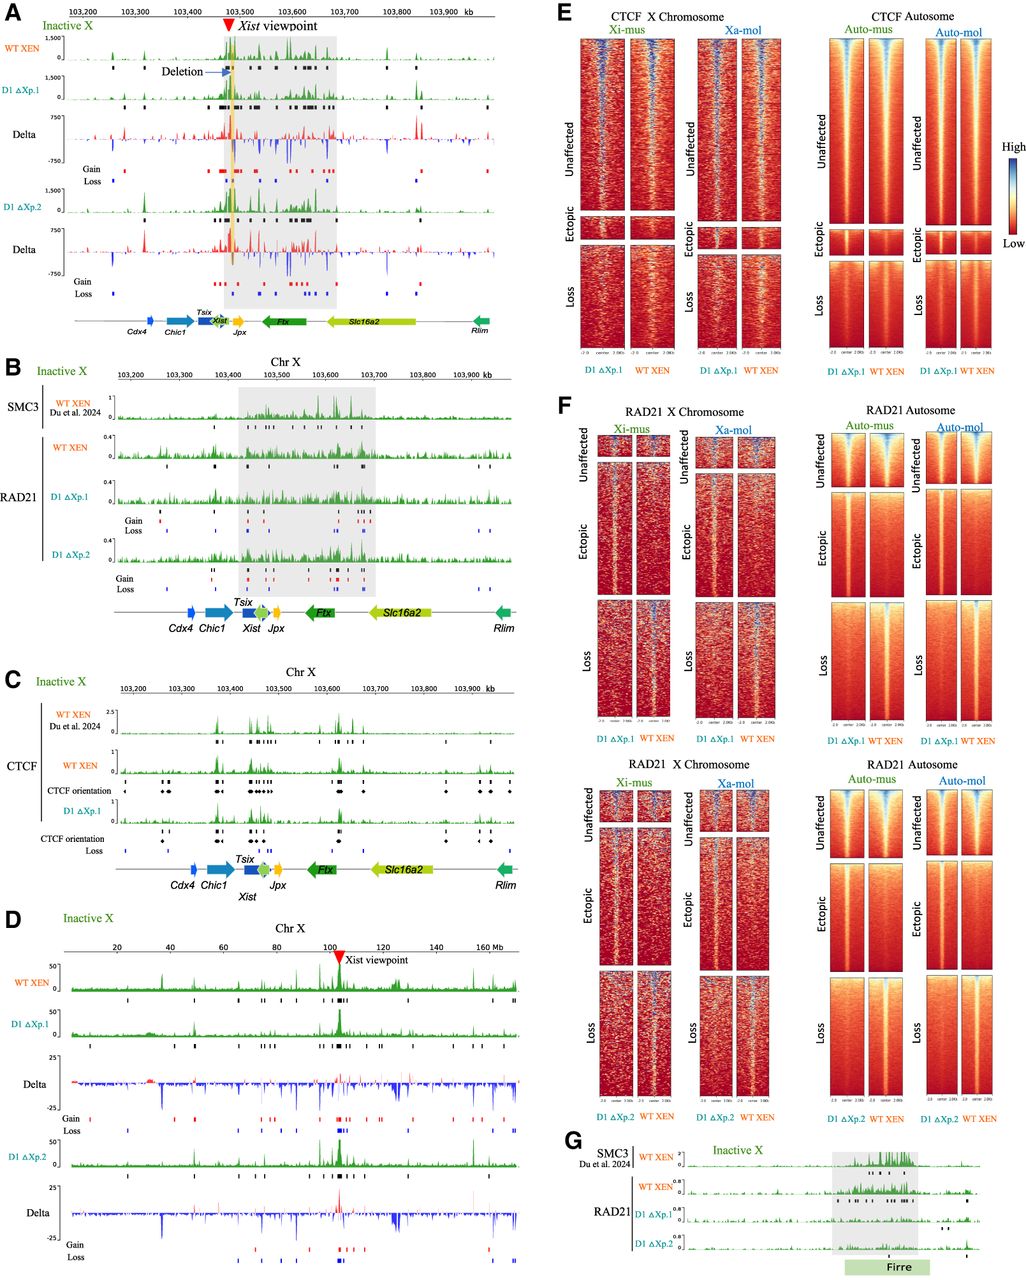
Deletion of Xist upstream sequences leads to genome-wide changes in Xist interaction and alterations of CTCF, RAD21 binding. (A) Xi-specific 4C interaction profiles of the Xist locus with genomic region across the Xic in WT XEN versus D1 ΔXp.1 (top) and WT versus D1 ΔXp.2 (bottom). The red arrow marks the viewpoint at the Xist. Black boxes below each track denote significant interactions. Delta plots represent the differences in interactions between WT versus D1 ΔXp cells. Gains and losses of interactions are marked through red and blue boxes, respectively. The shaded area highlights alterations of interactions between WT versus D1 ΔXp cells in the region encompassing the Xist and Ftx loci. Deleted region is marked by a yellow line. (B) Tracks showing the Xi-specific enrichment of SMC3 in WT XEN (top) and RAD21 in WT XEN and D1 ΔXp.1 and D1 ΔXp.2 (bottom). Black boxes denote significant peaks under each track. Gains and losses of significant peaks are marked through red and blue boxes, respectively. The shaded area highlights alterations of RAD21 binding between WT versus D1 ΔXp cells in the region encompassing the Xist and Ftx loci. Analysis of RAD21 is based on ChIP-seq and SMC3 is based on CUT&RUN. (C) Tracks showing the Xi-specific enrichment of CTCF in WT XEN versus D1 ΔXp.1. Black boxes under each track denote significant peaks. Gains and losses of significant peaks are marked through red and blue boxes, respectively. CTCF orientations are denoted through black arrowheads. Analysis of CTCF XEN (XiMol XaMus) is based on CUT&RUN; others are based on ChIP-seq. (D) Xi-specific 4C interaction profiles of the Xist locus across the inactive X in WT XEN versus D1 ΔXp.1 (top) and WT versus D1 ΔXp.2 (bottom). The red arrow marks the viewpoint. Black boxes below each track denote significant interactions. Delta plots represent the differences in interactions between WT versus D1 ΔXp cells. Gains and losses of interactions are marked through red and blue boxes, respectively. (E) Allele-specific enrichment plots showing unaffected, ectopic, or lost CTCF peaks across the X Chromosome (left) and autosome (right) in D1 ΔXp.1 versus WT XEN lines. (F) Allele-specific enrichment plots showing unaffected, ectopic, or lost RAD21 peaks across the X Chromosome (left) and autosome (right) in D1 ΔXp.1 versus WT XEN lines (top) and D1 ΔXp.2 versus WT XEN lines (bottom). (G) Tracks showing Xi-specific SMC3 and RAD21 enrichments across the Firre locus for WT XEN, D1 ΔXp.1, and D1 ΔXp.2 lines. Black boxes denote significant peaks under each track. The shaded area highlights alterations of RAD21 binding between WT versus D1 ΔXp cells across the Firre locus.


