
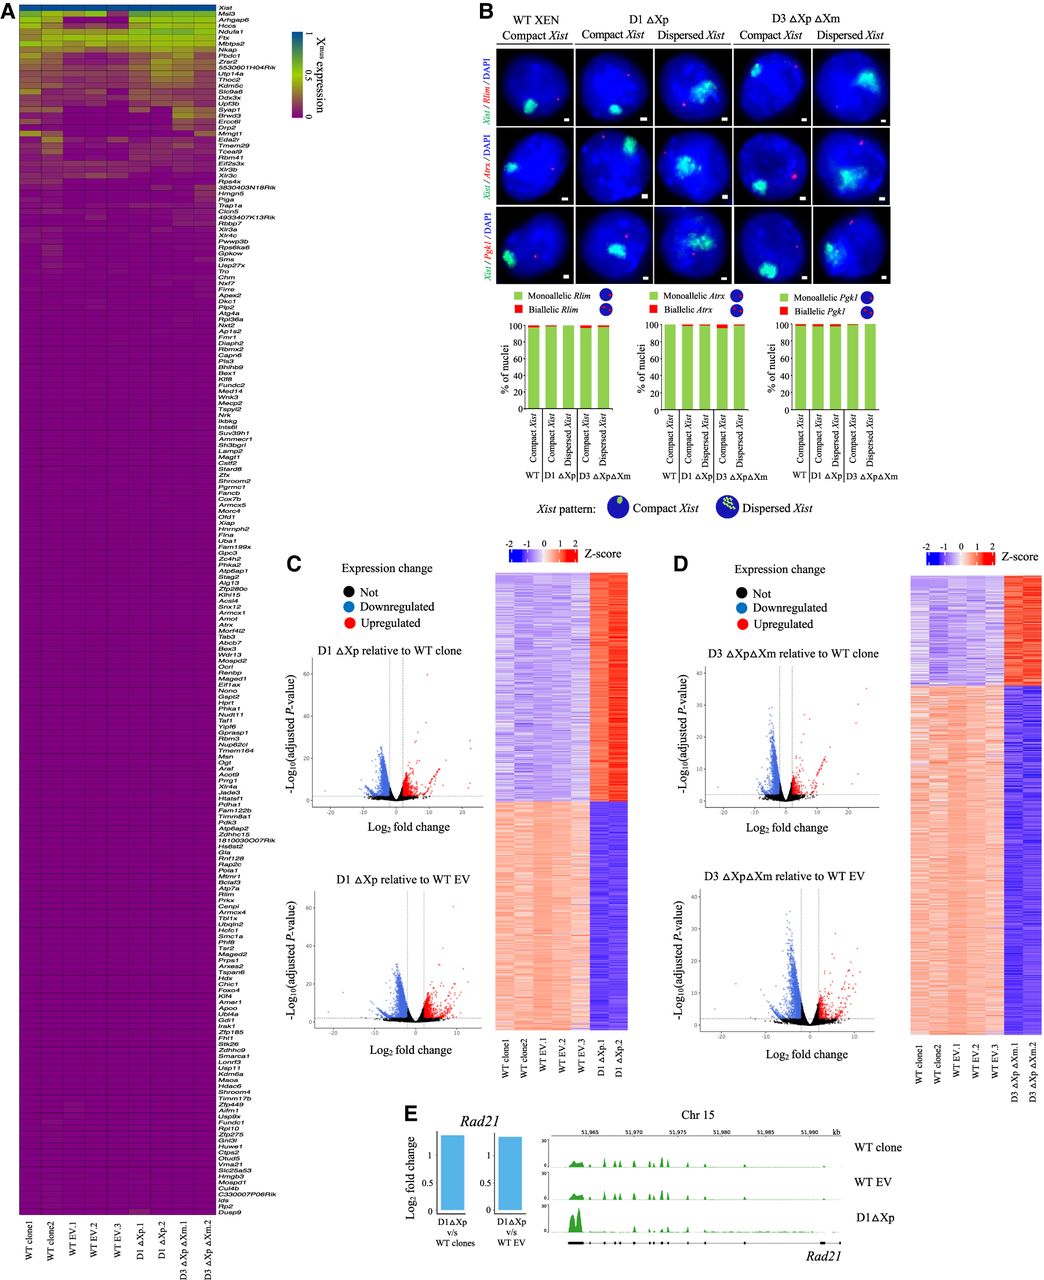
Xist upstream deletion affects autosomal gene expression. (A) Heat map showing the fraction allelic expression pattern of different X-linked genes for D1 ΔXp.1, D1 ΔXp.2, D3 ΔXpΔXm.1, and D3 ΔXp ΔXm.2 lines as compared to WT clones and WT EV clones (WT EV.1, WT EV.2, and WT EV.3). (B) Representative images of RNA-FISH for Xist (green) and X-linked genes Rlim, Atrx, and Pgk1 (red) in WT and D1 and D3 deletion lines. Bottom: Quantification of mono/biallelic expression of Rlim (n = 109, 109, 86, 116, 126), Atrx (n = 103, 85, 101, 159, 136), or Pgk1(n = 117, 118, 102, 120, 88) in nuclei having compact versus dispersed Xist clouds. A single-stranded RNA probe was used to detect Xist. (C) Left: Volcano plots representing the differentially expressed genes in D1 ΔXp relative to WT clones and WT EV clones (DESeq2: log2 FC > 2; FDR < 0.01). Right: Heat map showing the top differentially expressed genes in D1 ΔXp relative to WT clones and WT EV clones. (D) Left: Volcano plots representing the differentially expressed genes in D3 ΔXpΔXm relative to WT clones and WT EV clones (DESeq2: log2 FC > 2; FDR <0.01). Right: Heat map showing the differentially expressed genes in D3 ΔXpΔXm relative to WT clones and WT EV clones. (E) Left: Plots showing fold changes of Rad21 expression as seen through RNA-seq for D1 ΔXp lines as compared to WT clones and WT EV clones. Right: Genome browser views showing Rad21 expression across the genomic loci for WT clone, WT EV, and D1 ΔXp lines.


