
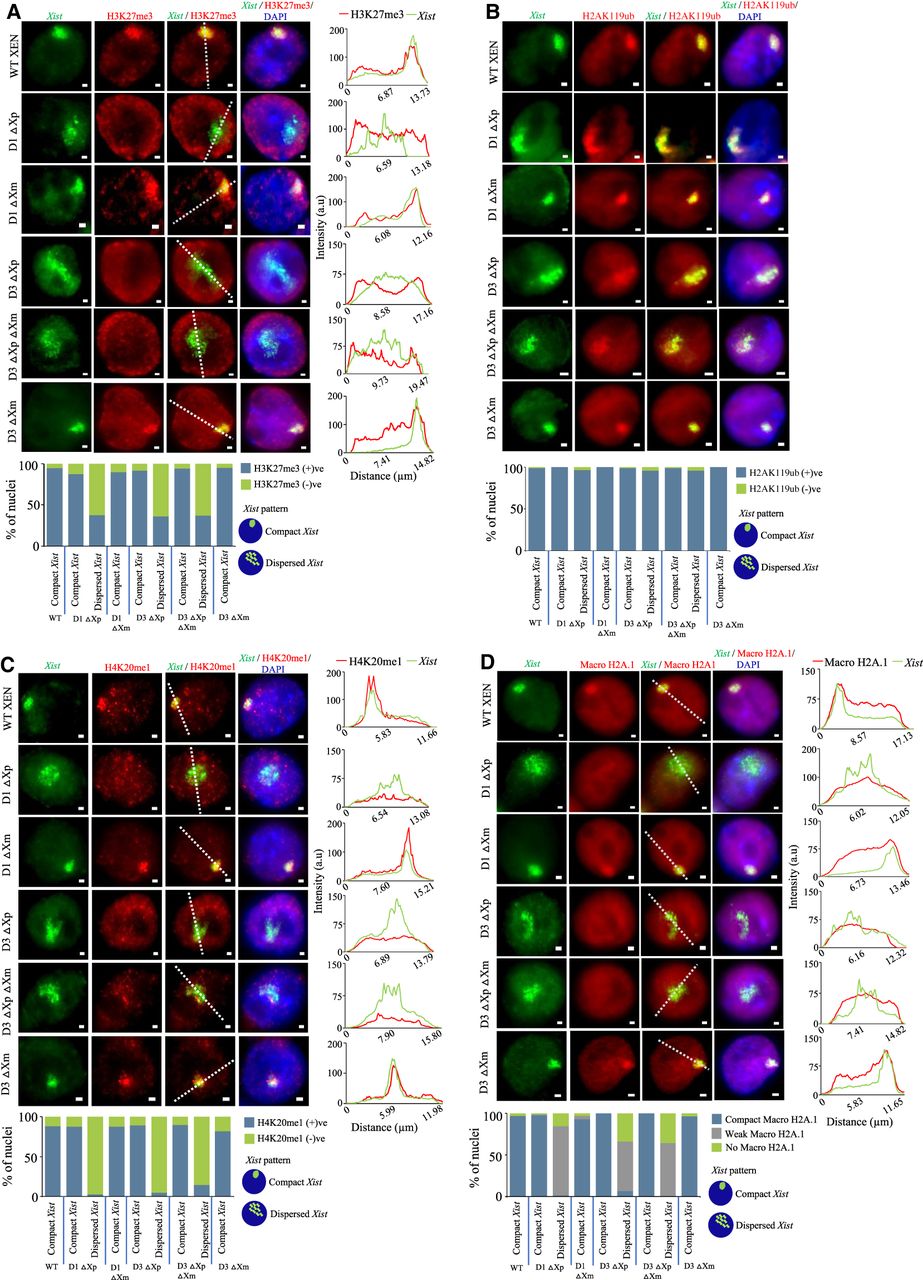
Xist dispersal is associated with the loss of enrichment of repressive chromatin marks on the inactive X. (A) Representative images of IF-RNA FISH of H3K27me3 (red) and Xist (green) for WT XEN, D1 ΔXp, D1 ΔXm, D3 ΔXp, D3 ΔXp ΔXm, and D3 ΔXm lines. Right: Corresponding fluorescent intensity profiles for Xist and H3K27me3 along the white line drawn across the Xist cloud. Bottom: Quantification of the enrichment of H3K27me3 on the inactive X in compact and dispersed Xist nuclei. n = 129, 108, 66, 96, 112, 105, 132, 100, 145 (for each data point from left to right). (B) Representative IF-RNA FISH images for H2AK119ub (red) and Xist (green) for D1 and D3 deleted lines. Bottom: Quantification of the the enrichment of H2AK119ub on the inactive X in compact and dispersed Xist nuclei. n = 120, 123, 128, 126, 108, 146, 135, 127, 116 (for each data point from left to right). (C) IF-RNA FISH images with corresponding intensity profiles for H4K20me1 (red) and Xist (green). Bottom: Quantification for enrichment of H4K20me1 in compact and dispersed Xist nuclei. n = 137, 153, 135, 155, 131, 141, 133, 129, 143 (for each data point from left to right). (D) Macro H2A.1 (red) and Xist (green) IF-RNA FISH representative images with their corresponding intensity profiles are shown. Bottom: Quantification of compact, weak, and no Macro H2A.1 signals in nuclei having compact and dispersed Xist clouds in the D1 and D3 deleted lines. n = 120, 158, 137, 138, 116, 106, 110, 109, 135 (for each data point from left to right). A single-stranded RNA probe was used to detect Xist.


