
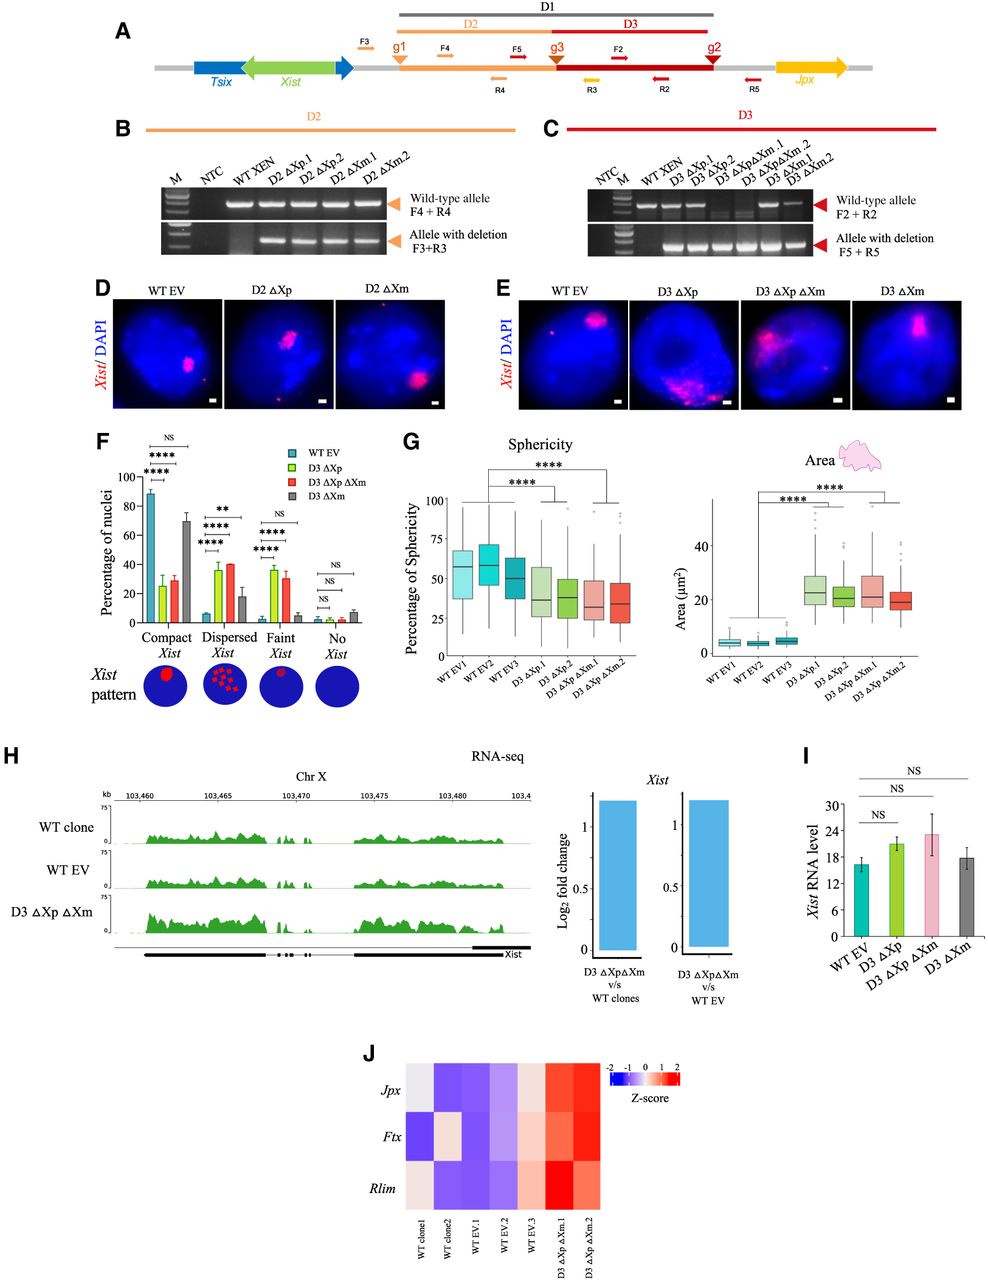
Segmental deletions of the Xist upstream sequence. (A) Schematic showing the segmental deletions (D2 and D3) regions upstream of Xist. Guide RNA target sites are represented as arrowheads (g1 and g3) for the D2 deletion and as arrowheads (g3 and g2) for the D3 deletion. Primer pairs are shown as orange and red arrows, F3 and R3 amplify the deleted allele, and F4 and R4 amplify the wild-type allele of the D2 deletion. F2 and R2 amplify the undeleted allele, and F5 and R5 amplify the deleted allele of the D3 deletion. (B) PCR-based identification of D2 paternally (D2 ΔXp.1 and D2 ΔXp.2) and maternally deleted clones (D2 ΔXm.1 and D2 ΔXm.2). Orange arrows mark the position of the expected amplicons. M denotes marker and NTC: no template control. (C) PCR for the paternally (D3 ΔXp.1 and D3 ΔXp.2), homozygous (D3 ΔXp ΔXm.1 and D3 ΔXp ΔXm.2) and maternally (D3 ΔXm.1 and D3 ΔXm.2) deleted lines of the D3 deletion. Red arrowheads mark the position of the amplicons. The primers used for each PCR are indicated on the right. (D) RNA-FISH for WT EV and D2 deletion clones using double-stranded Xist/Tsix-Cy3 (red) probe. Nuclei are counterstained with DAPI (blue). Scale bars: 1 µm. (E) RNA-FISH using double-stranded DNA probe for Xist/Tsix-Cy3 (red) in WT EV, D3 ΔXp, ΔXpΔXm, and ΔXm clones. Scale bars: 1 µm. (F) Quantification of the pattern of different Xist coating in the D3 deleted clones. n = 3 for WT EV clones and n = 2 for each of D3 ΔXp, D3 ΔXpΔXm, and D3 ΔXm clones. P values (two-way ANOVA): (****) P ≤ 0.0001, (**) P ≤ 0.01. (G) Quantification of the sphericity and area occupied by the Xist clouds in the D3 deleted (homozygous and paternally deleted) clonal lines and WT EV clones. P values (Mann–Whitney U test): (****) P ≤ 0.0001. n = 113, 100, 110, 99, 102, 98, 97. (H) Left: Genome browser view of Xist expression for WT clones, WT EV and D3 ΔXpΔXm clones as obtained from RNA-seq. Right: Bar plots representing the log2 fold change for Xist in D3 ΔXpΔXm over WT clone and WT EV clones. (I) RT-qPCR for analysis of Xist expression levels normalized to Tbp for the D3 deleted lines. (J) Heat map showing the increased expression of Jpx, Ftx, and Rlim in D3 ΔXpΔXm cells compared to the WT clone and WT EV clones.


