
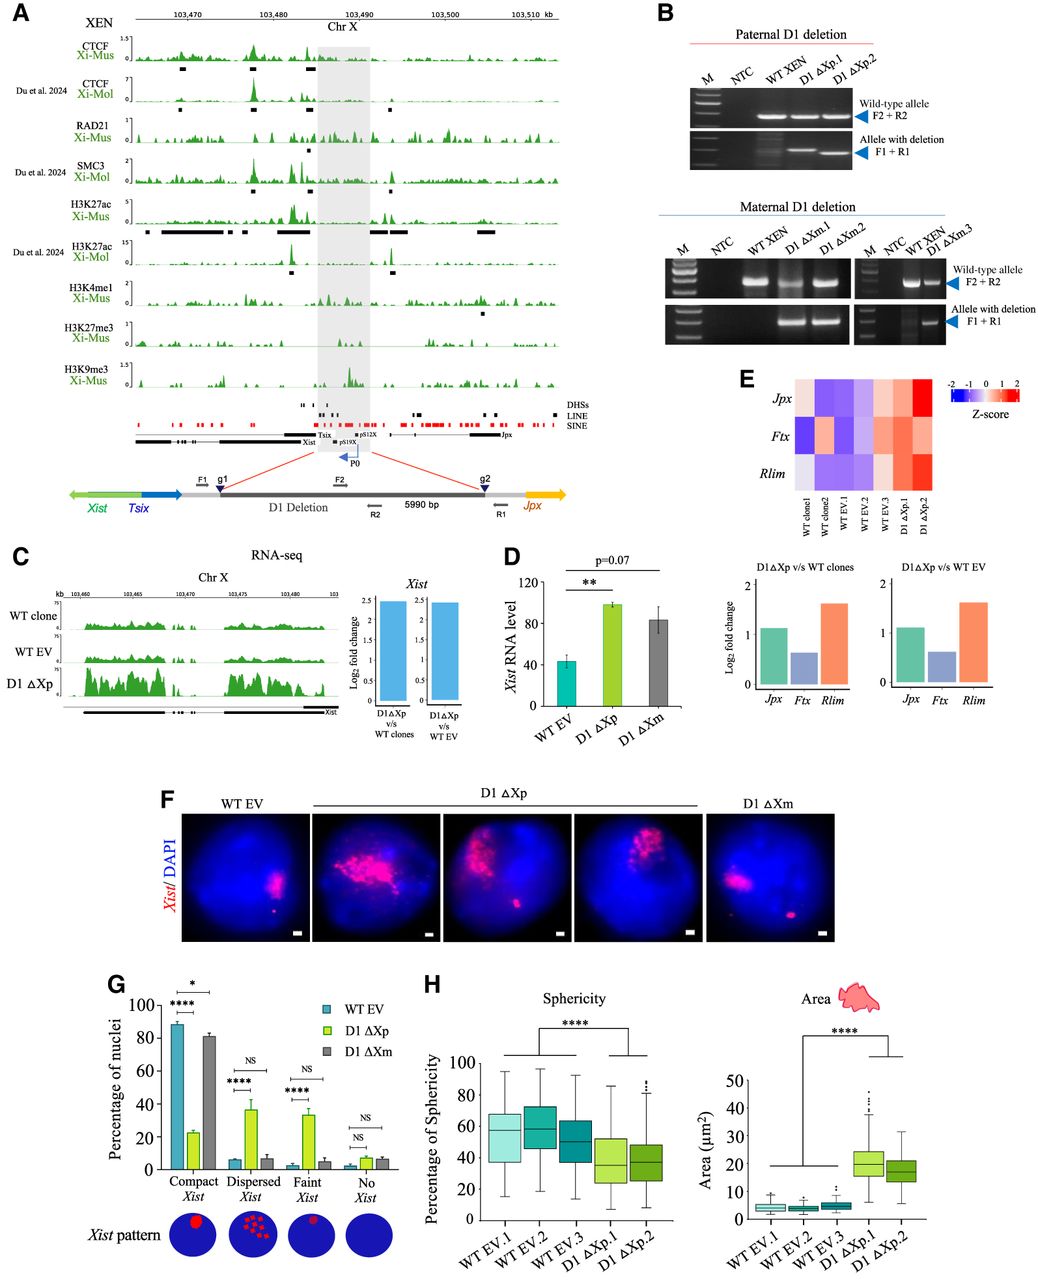
Xist upstream deletion leads to Xist upregulation and Xist dispersal. (A) Top: Plots showing the enrichment of CTCF, RAD21, SMC3, H3K27ac, H3K4me1, H3K27me3, and H3K9me3 at the Xist upstream region targeted for the deletion (shaded) in the Xi of XEN cells. Black boxes denote significant peaks under each track. Enrichment of LINE (black boxes) and SINE (red boxes) elements, DHSs (black boxes) are indicated. Analysis of CTCF XEN (XiMus XaMol), RAD21, H3K27ac, H3K4me1, H3K27me3, and H3K9me3 is based on ChIP-seq. CUT&RUN data of CTCF XEN (XiMol XaMus) and SMC3 XEN obtained from Du et al. (2024). Bottom: Schematic showing the region intermediate to Tsix and Jpx that is targeted for deletion in XEN cells. sgRNA binding sites: g1 and g2. PCR primers F2 and R2, and F1 and R1 shown as gray arrows used for amplification of the wild-type allele and the allele with deletion, respectively. (B) PCR-based identification of clones having the deletion of the Xist upstream region (D1) on the paternal allele (top) and maternal allele (bottom). Arrowheads represent the position of the expected amplicon. Primer pairs used for each deletion are shown on the right. NTC stands for no template control and M for Marker. (C) Left: Genome browser view of Xist expression for WT clones, WT EV, and D1 ΔXp clones as observed through RNA-seq. Right: Bar plots representing the log2 fold change for Xist (>2.4 log2 fold change; FDR ≤0.01) in D1 ΔXp over WT clone and WT EV clones as seen through RNA-seq analysis. (D) Analysis of Xist expression levels by RT-qPCR in WT EV and D1 deleted clones. Tbp is used as the normalizing control. n = 3 biological replicates for each of WT EV and D1 ΔXm and n = 2 for D1 ΔXp was used. Error bars represent the standard error of mean. P values (two-tailed t–test): (**) P ≤ 0.01. (E) Top: Heat map showing the increased expression of Jpx, Ftx, and Rlim in D1 ΔXp cells compared to the WT clone and WT EV clones. Bottom: Plots showing the log2 fold change in expression levels of Jpx, Ftx, Rlim in D1 ΔXp versus WT clone and WT EV clones as quantified through RNA-seq. (F) RNA-FISH using double-stranded DNA probe for Xist/Tsix-Cy3 (red) in wild-type empty-vector transfected (WT EV) and heterozygous clones of both paternally (D1 ΔXp) and maternally (D1 ΔXm) deleted clones. DAPI (blue) counterstains the nucleus. Scale bars: 1 µm. (G) Plot representing the quantification of the Xist RNA-FISH signals in WT EV and heterozygous (D1 ΔXp and D1 ΔXm) clones. Bottom: Schematic representing different types of Xist pattern. n = 3 biological replicates in each of WT EV and D1 ΔXm and n = 2 for D1 ΔXp. P values (two-way ANOVA): (****) P ≤ 0.0001, (*) P ≤ 0.05 and NS implies nonsignificant. (H) Box plots representing the quantification of sphericity and the area occupied by Xist clouds in WT EV clones and clones with paternal D1 deletion. P values (Mann–Whitney U test): (****) P ≤ 0.0001. n = 113, 100, 110, 100, 103.


