
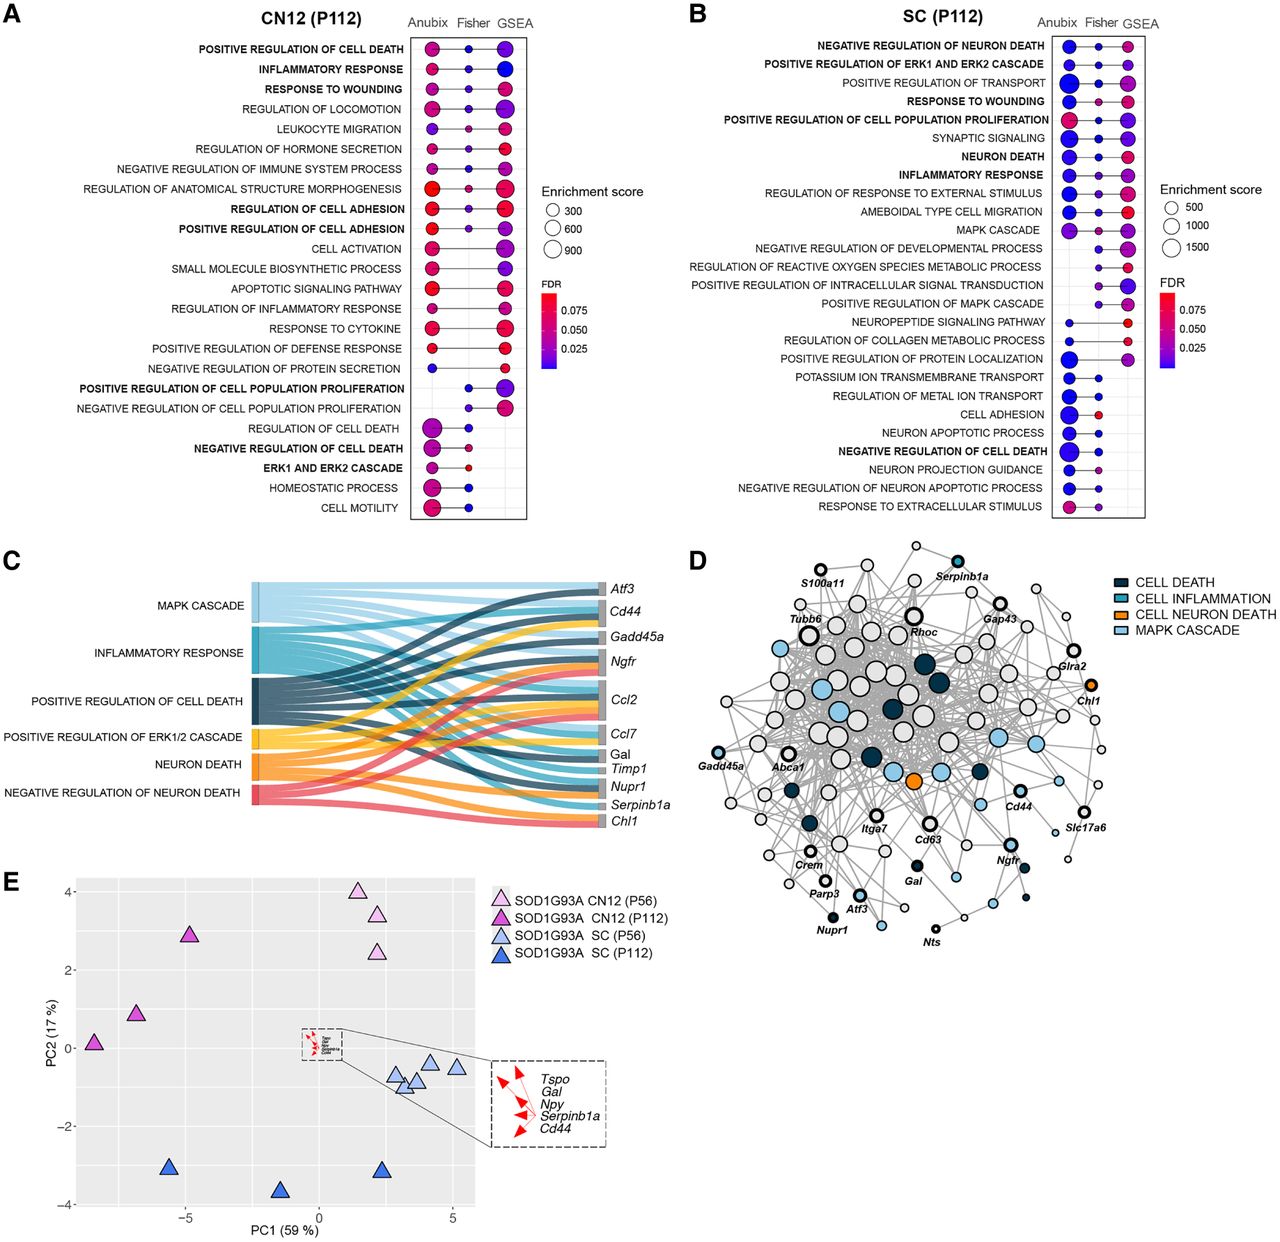
Pathway analysis shows a common detrimental response across vulnerable populations. (A,B) GO enrichment dot plots showing significantly enriched pathways that were enriched in at least two of the pathway analysis methods (Fisher test, FGSEA, Anubix) for CN12 and SC at P112. Enrichment scores correspond to the number of functional genes that the method shows being related for the enrichment term. FDR threshold <0.1. (C) Sankey plot showing functional categorization of stress-related genes in CN12 and SC at P112. (D) Functional network analysis on genes shared between CN12 and SC at P112 using Funcoup 5 with all evidence types. Evidence types are the signals that support or contradict the presence of functional coupling. In Funcoup 5, the evidence types included are domain interactions, genetic interaction profile similarity, gene regulation, mRNA coexpression, microRNA regulation, protein coexpression, phylogenetic profile similarity, physical interaction, subcellular localization, and transcription factor binding profile. (E) PCA plot illustrates the clustering pattern of samples based on DEGs belonging to common detrimental pathways (“positive regulation of cell death,” “inflammatory response,” “response to wounding,” “negative regulation of cell death,” “ERK1 and ERK2 cascade”) for CN12 and SC cell types at P112. The top five loading genes for PC1 are highlighted in the plot.


