
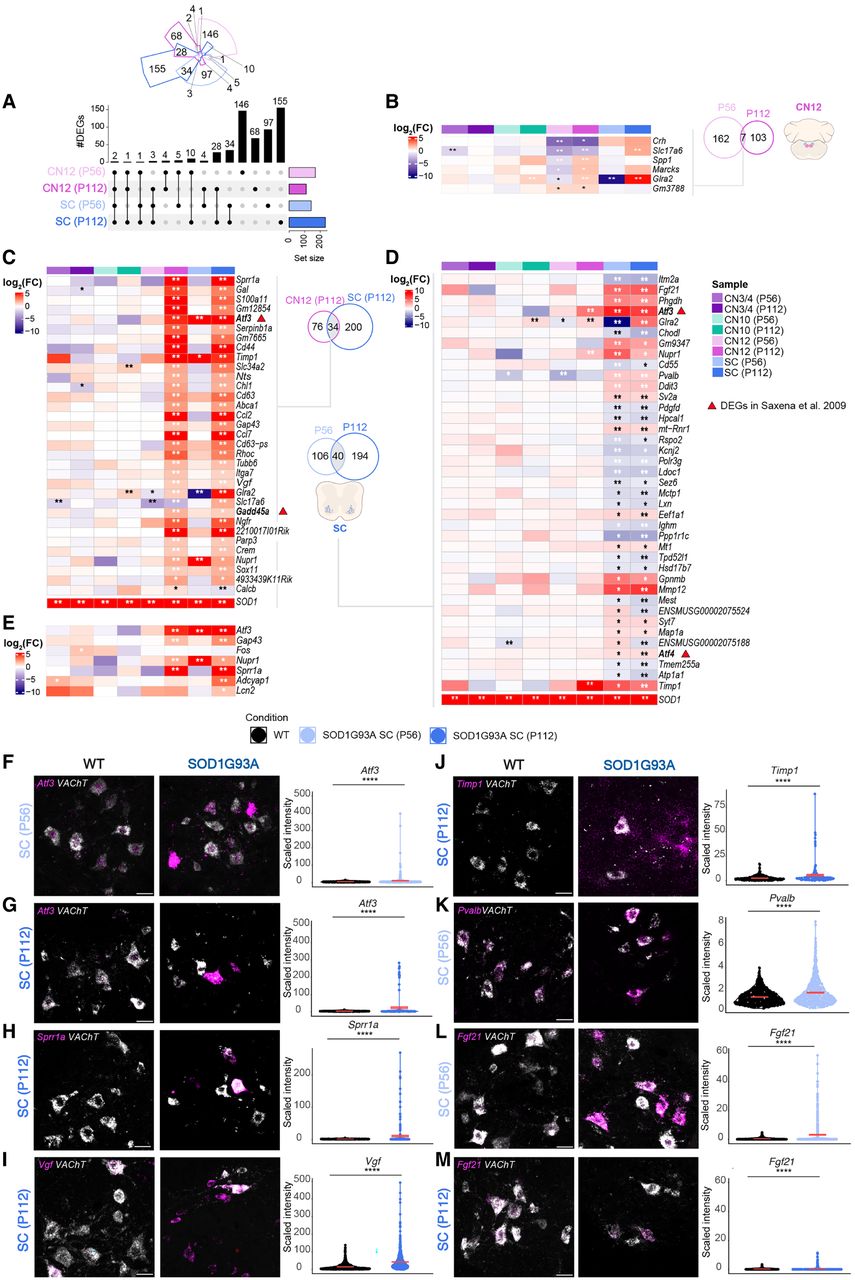
Vulnerable MNs show unique regulation of injury response genes. (A) Upset plot showing DEGs in vulnerable populations (CN12 and SC) at P56 and P112. Likelihood ratio test, Benjamini–Hochberg adjusted P-value < 0.05. (B) Heatmap showing logFC expression of shared DEGs between ages in CN12. (C) Heatmap showing logFC expression of common DEGs between CN12 and SC at P112. (D) Heatmap showing logFC expression of common DEGs between ages in SC MNs. (E) Heatmap showing logFC expression of DEGs related to nerve injury response. (B–E) Genes in bold represent DEGs also dysregulated in the work of Saxena et al. (2009). Likelihood ratio test, (**) Benjamini–Hochberg FDR < 0.01, (*) Benjamini–Hochberg FDR < 0.05. Representative RNAscope images with quantification of signal intensity of Atf3 in SC at P56 (n for WT = 407; n for SOD1G93A = 281; F) and P112 (n for WT = 340; n for SOD1G93A = 136; G), Sprr1a in SC at P112 (n for WT = 321; n for SOD1G93A = 218; H), Vgf in SC at P112 (n for WT = 1031; n for SOD1G93A = 704; I), Timp1 in SC at P112 (n for WT = 340; n for SOD1G93A = 136; J), Pvalb in SC at P56 (n for WT = 606; n for SOD1G93A = 523; K), and representative RNAscope image of Fgf21 in SC at P56 (n for WT = 592; n for SOD1G93A = 508; L) and P112 (n for WT = 434; n for SOD1G93A = 258; M). (F–M) Scale bars, 30 µm. Permutation test, (ns) P > 0.05, (*) P ≤ 0.05, (**) P ≤ 0.01, (***) P ≤ 0.001, (****) P ≤ 0.0001.


