
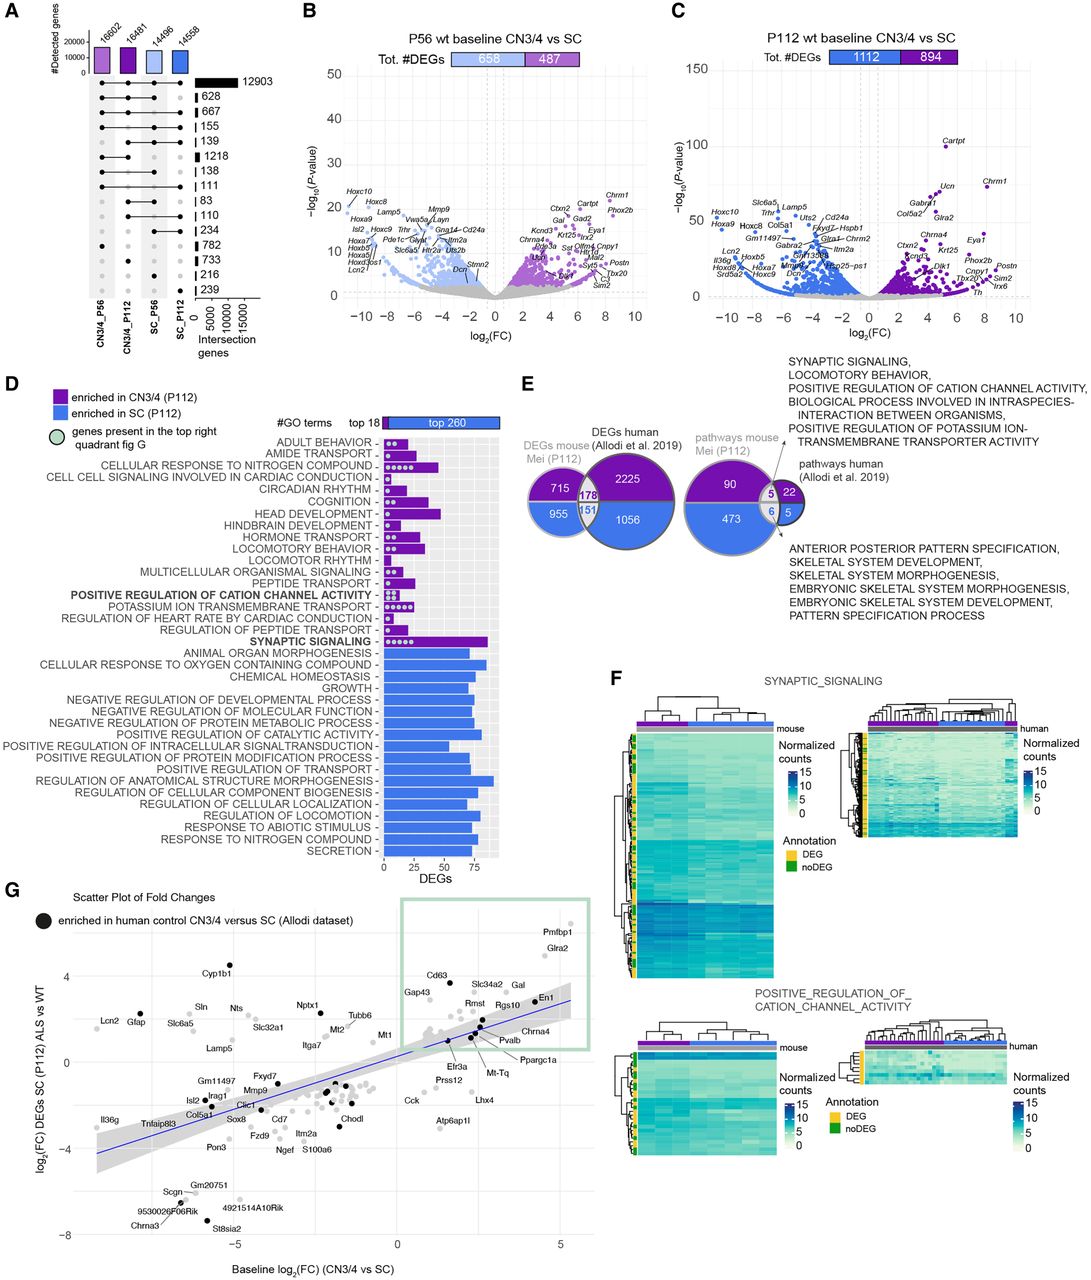
Baseline gene expression in CN3/4 MNs may hold the key to their resilience. (A) Upset plot showing the number of detected genes in CN3/4 and SC in WT mice at P56 and P112. (B) Volcano plot of DEGs at P56 comparing CN3/4 (light purple) versus SC (light blue), highlighting genes enriched in each population. Likelihood ratio test, Benjamini–Hochberg adjusted P-value < 0.05. (C) Volcano plot of DEGs at P112 comparing CN3/4 (purple) versus SC (blue), showing an increased number of DEGs at the symptom-onset stage. Likelihood ratio test, Benjamin–Hochberg adjusted P-value < 0.05. (D) Gene Ontology (GO) term enrichment analysis performed using FGSEA showing enriched GO terms in WT CN3/4 or WT spinal (SC) MNs at P112. (E) Comparison of DEGs and enriched pathways between the mice (Mei_P112 data set) and humans (Allodi et al. 2019). (F) Heatmaps of selected pathways and genes enriched in control CN3/4 MNs in mice and in humans. (G) Scatter plot comparing ALS-induced expression changes in SC (P112) with baseline gene expression differences between CN3/4 and SC, identifying genes that may contribute to CN3/4 resistance. Each dot corresponds to a gene. Genes labeled in bold represent those also identified in the human baseline data set (Allodi et al. 2019). The blue line represents the linear regression of fold changes, with the shaded region showing the 95% confidence interval. Highlighted genes in the green box exhibit higher expression in CN3/4 baseline and are induced in our SC at P112 samples, making them potential candidates for further investigation.


