
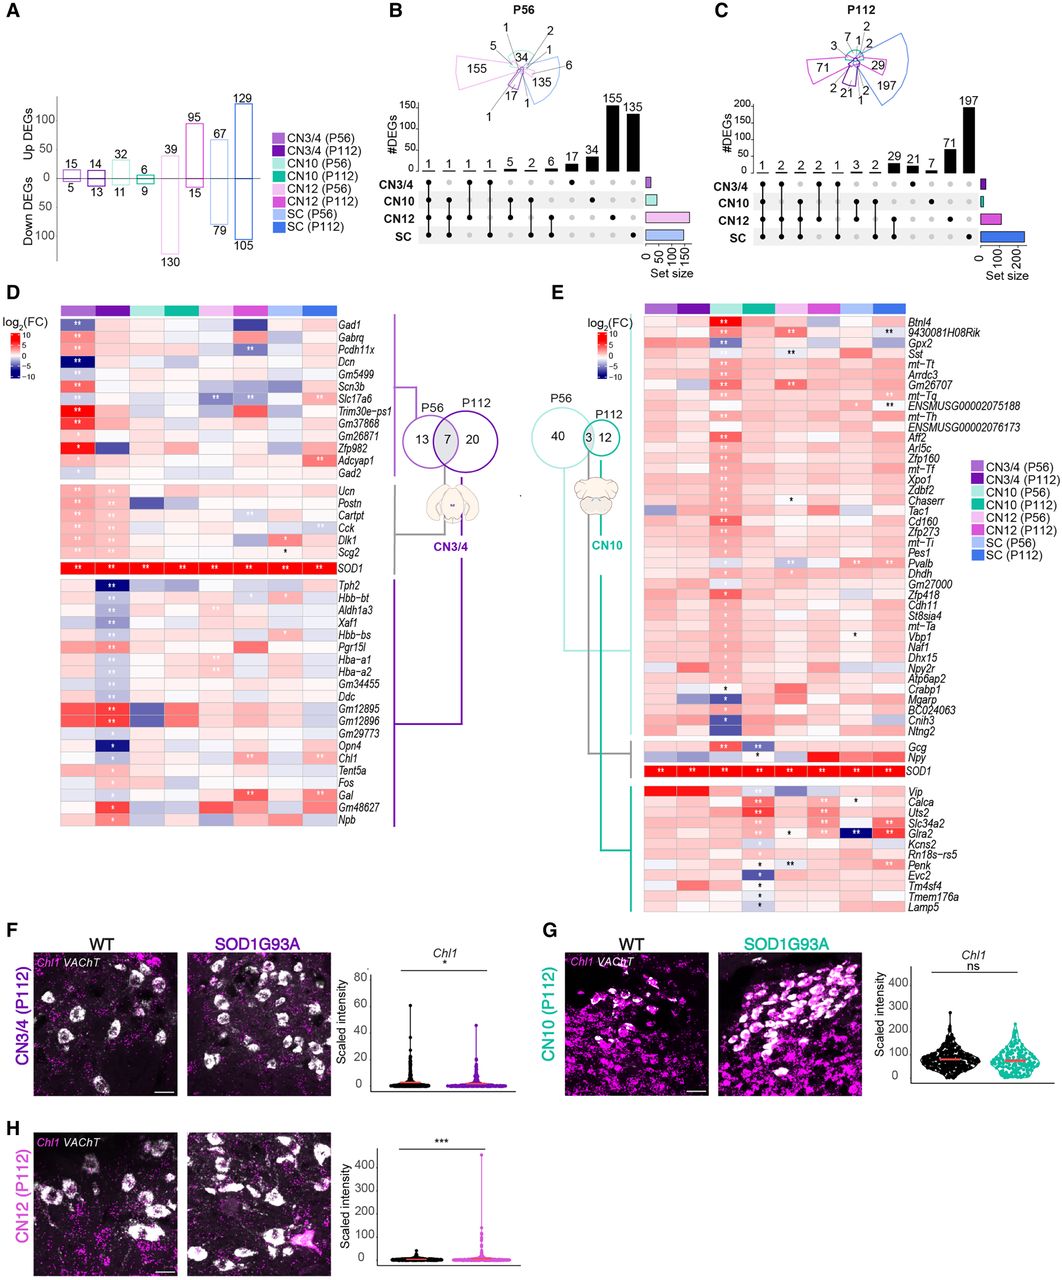
Relatively resistant MNs show little gene dysregulation in response to mutant SOD1. (A) Bar plots of differentially expressed genes (DEGs) across MN populations in SOD1G93A versus WT mice, highlighting a low number of DEGs in CN3/4 compared with other MN populations. Numbers on top and bottom of each bar represent, respectively, the number of up and down DEGs. (B,C) Upset plots of DEGs at P56 and P112, showing the number of genes differentially expressed across CN3/4, CN10, CN12, and SC at different disease stages. Likelihood ratio test, Benjamini–Hochberg adjusted P-value < 0.05. (D) Heatmap showing log fold change (logFC) values of the DEGs across disease stages for CN3/4 at both P56 and P112, showing relatively few significant changes compared with other MN populations. Likelihood ratio test, (**) Benjamini–Hochberg adjusted P-value < 0.01, (*) Benjamini–Hochberg adjusted P-value < 0.05. (E) Heatmaps showing log expression of the DEGs across disease stages for CN10. Likelihood ratio test, (**) Benjamini–Hochberg adjusted P-value < 0.01, (*) Benjamini–Hochberg adjusted P-value < 0.05. (F–H) RNAscope images of Chl1 mRNA expression in CN3/4 (n for WT = 376; n for SOD1G93A = 319), CN10 (n for WT = 377; n for SOD1G93A = 206), and CN12 (n for WT = 530; n for SOD1G93A = 508), at P112 with quantification of signal intensity. Scale bars, 30 µm. Permutation test (ns) P > 0.05, (*) P ≤ 0.05, (**) P ≤ 0.01, (***) P ≤ 0.001, (****) P ≤ 0.0001.


