
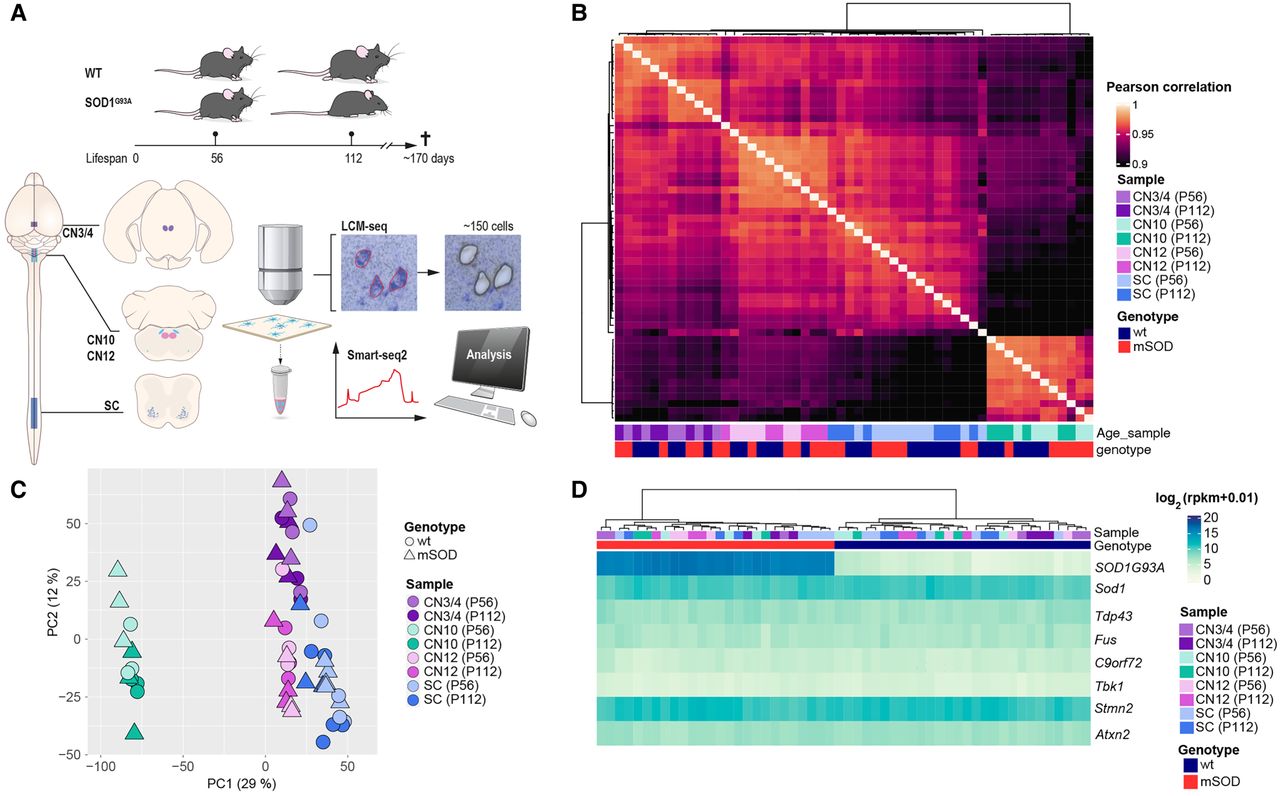
Motor neuron (MN) subpopulations show unique transcriptional profiles but similar levels of ALS disease gene expression. (A) Schematic representation of the study design and laser capture microdissection (LCM) coupled with RNA sequencing (LCM-seq) workflow. We used SOD1G93A mice, a well-established ALS model, and their wild-type (WT) littermates as controls at postnatal day 56 (P56; presymptomatic) and postnatal day 112 (P112; onset of symptoms). LCM was performed to isolate MNs from three cranial nerve (CN) nuclei (CN3/4, CN10, CN12) and the lumbar (L5) spinal cord (SC), followed by Smart-seq2 RNA sequencing for transcriptome analysis. (B) Pairwise Pearson's correlation heatmap of variance-stabilized transformed (VST) gene expression data, showing hierarchical clustering of samples by cell type, genotype, and age. A single linkage method was used for the hierarchical clustering of columns. (C) Principal component analysis (PCA) based on whole-transcriptome expression data highlights clear separation between different MN subtypes, with genotype and age also influencing clustering. (D) Heatmap of key ALS-associated genes (Sod1, Tardp43, Fus, C9orf72, Tbk1, Stmn2, Atxn2), showing no major differences across MN populations. (CN12) Hypoglossal nucleus, (CN10) dorsal motor nucleus of the vagus nerve, (CN3/4) oculomotor and trochlear nuclei.


