
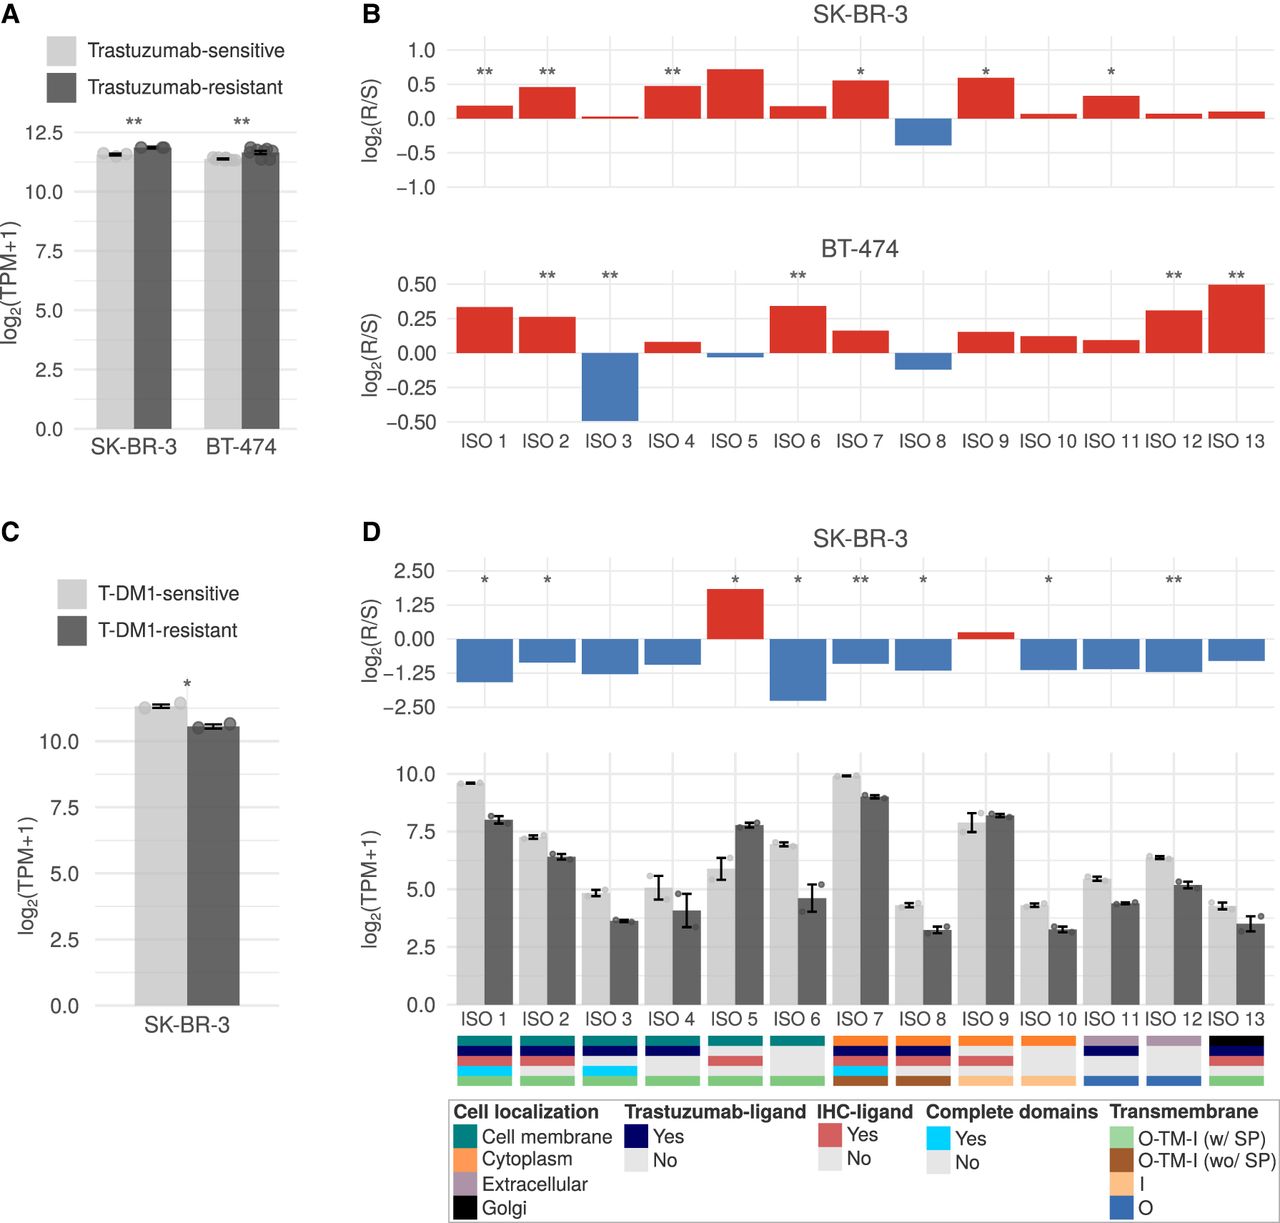
HER2 gene and isoform expression profiles in breast cancer cell lines before and after acquiring resistance to HER2-targeted therapies. (A) Overall HER2 expression in trastuzumab-sensitive (S) and trastuzumab-resistant (R) SK-BR-3 and BT-474 cells. (B) log2 fold change of HER2 isoform expression in trastuzumab-resistant versus sensitive SK-BR-3 and BT-474 cells. (C) Overall HER2 expression in T-DM1-sensitive and T-DM1-resistant SK-BR-3 cells. (D) HER2 isoform expression levels and characteristics in T-DM1-sensitive and T-DM1-resistant SK-BR-3 cells, with log2 fold change shown above. Isoforms are categorized based on their cell localization, trastuzumab-binding ligand presence (T-ligand), structural completeness and transmembrane topology as indicated by the bottom color legend: (O) outside, (TM) transmembrane region, (I) inside, (SP) signal peptide. Mann–Whitney U test statistical significance: (*) P-value < 0.05, (**) P-value < 0.01. Comparisons without statistical significance are not depicted in the figure.


