
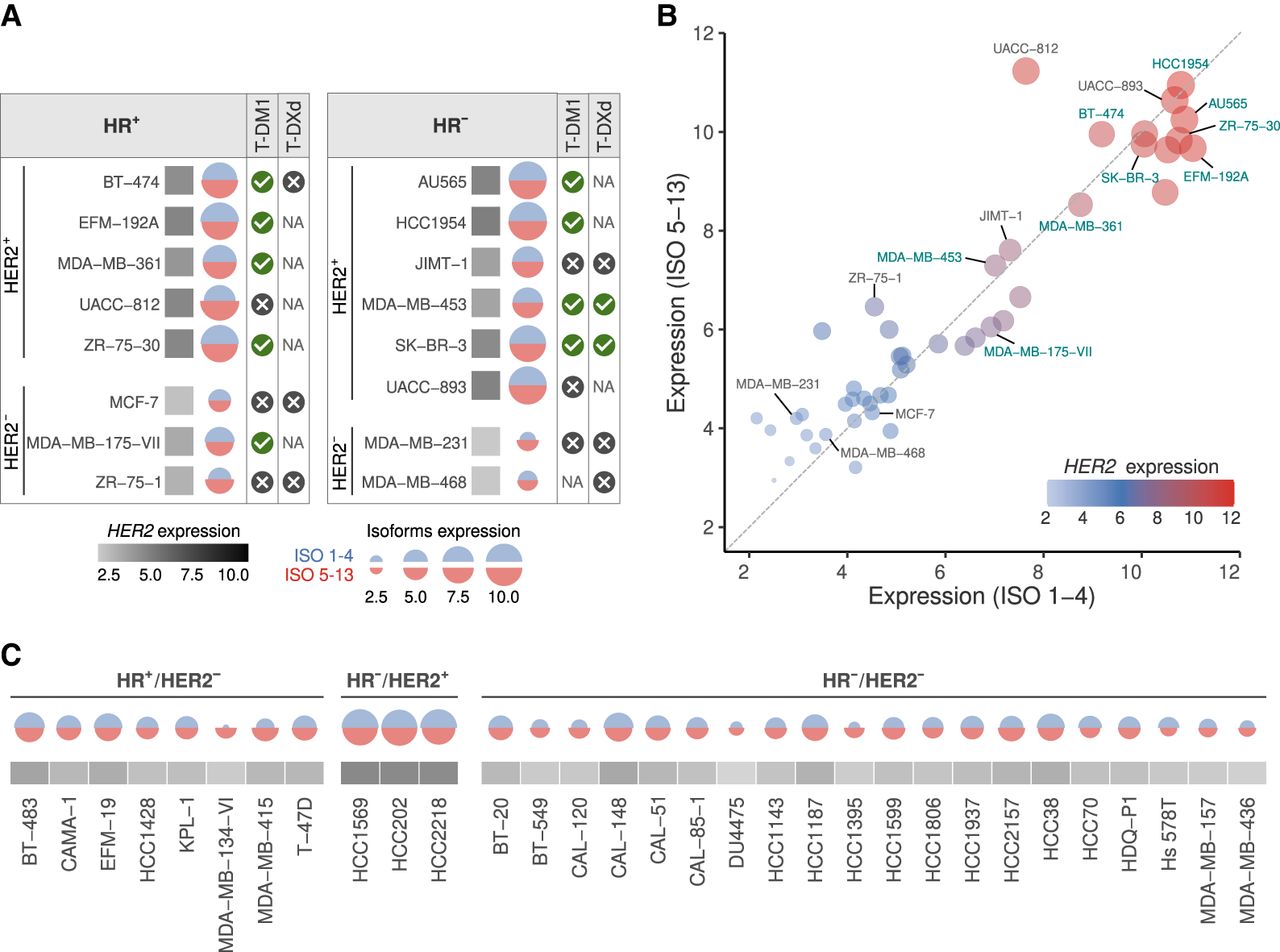
HER2 splicing isoform profiles in breast cancer cell lines and their response to T-DM1 and T-DXd. (A) HER2 isoform expression in HR+ (left) and HR− (right) breast cancer cell lines treated with T-DXd or T-DM1. Cell lines responsive to treatment are marked with a checkmark. Unresponsive cell lines are marked with a cross. (NA) Drug treatment is not available. The square block's color represents the total HER2 expression level (log2(TPM + 1)). Blue semicircular plots indicate the expression of isoforms with intact trastuzumab-binding domain (ISO 1–4). Red semicircular plots represent the expression of isoforms lacking trastuzumab-binding domain and/or cell membrane localization (ISO 5–13). (B) Scatter plot showing the relationship between expression levels of ISO 1–4 and ISO 5–13 groups across breast cancer cell lines. Dot size and color intensity correspond to total HER2 expression level (log2(TPM + 1)). Cell lines named in green indicate those responsive to ADCs (T-DM1 or T-DXd). Cell lines named in gray indicate those ADC-resistant. (C) HER2 isoform expression patterns across breast cancer cell lines (without ADC treatment) stratified by HR/HER2 status. Semicircular plots represent expression levels of isoforms from groups 1–4 (blue) and 5–13 (red). The gray squares below indicate total HER2 expression levels.


