
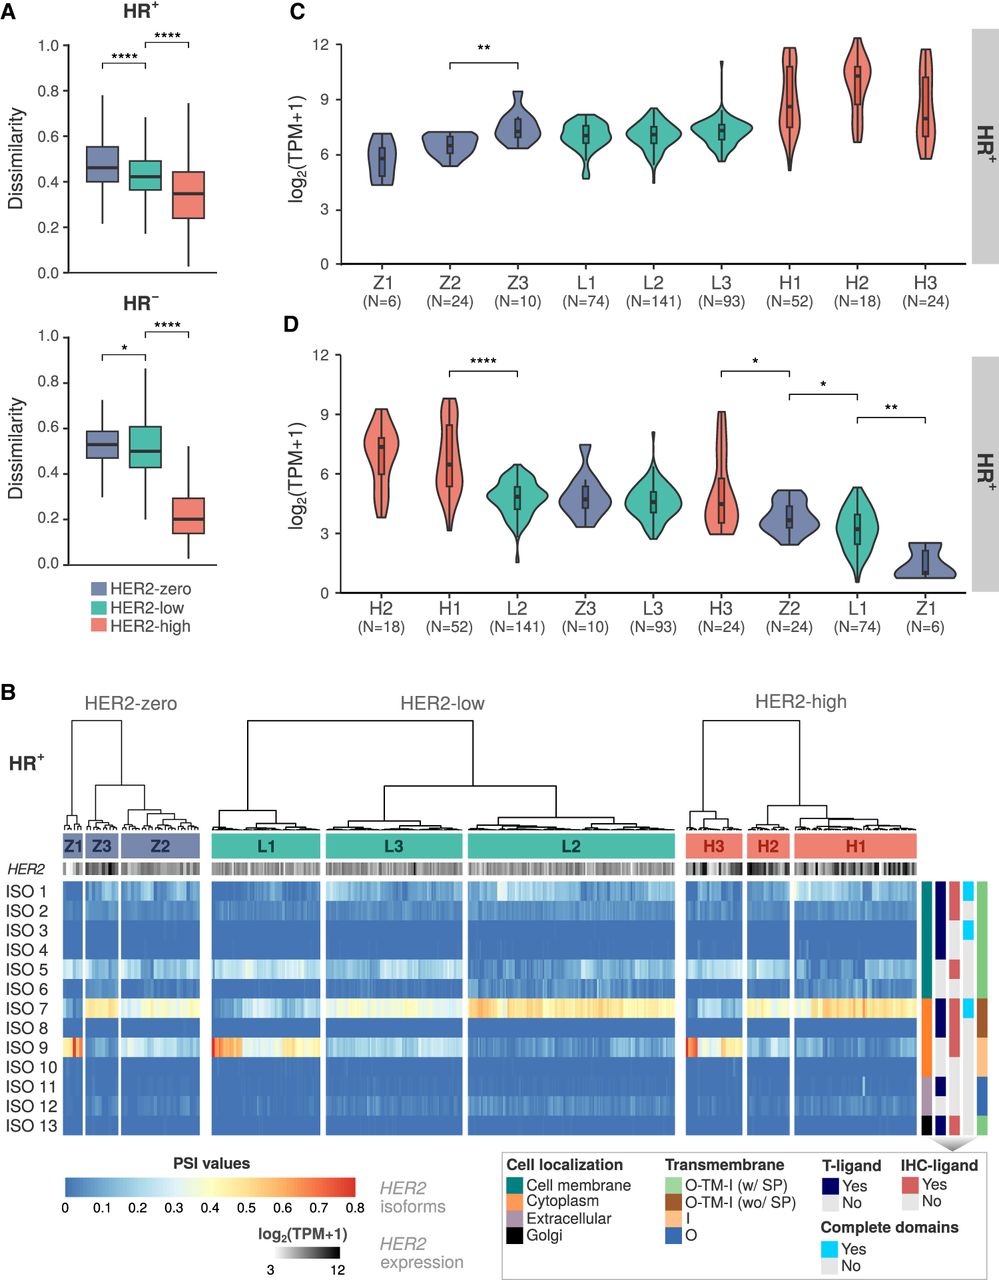
HER2 isoform expression patterns and clustering analysis in HR− and HR+ breast cancer patients stratified by HER2 status. (A) Jaccard index comparing the dissimilarity of HER2 isoform expression between HER2-zero (blue), HER2-low (green), and HER2-high (red) breast cancer samples in HR+ and HR− patients. Mann–Whitney U test significant differences in dissimilarity are noted between HER2 status categories: (*) P-value < 0.05, (****) P-value < 0.0001. (B) Heatmap of HER2 isoform percent spliced in (PSI) levels in HR+ patients, clustered by expression similarity. Z1, Z2, and Z3 are for HER2-zero; L1, L2, and L3 are for HER2-low; H1, H2, and H3 are for HER2-high. Isoform features (cell localization, antibody-binding sites, domain completeness, and transmembrane topology: [O] outside, [TM] transmembrane region, [I] inside, [SP] signal peptide) are indicated on the right. (C) HER2 gene expression levels among HR+ patient clusters. (D) Expression levels of HER2 isoforms whose encoded proteins are located in the cell membrane and contain the trastuzumab-ligand (groups ISO 1–4) among HR+ patient clusters. Mann–Whitney U test statistical significance: (*) P-value < 0.05, (**) P-value < 0.01, (****) P-value < 0.0001. Comparisons without statistical significance are not depicted in the figure.


