
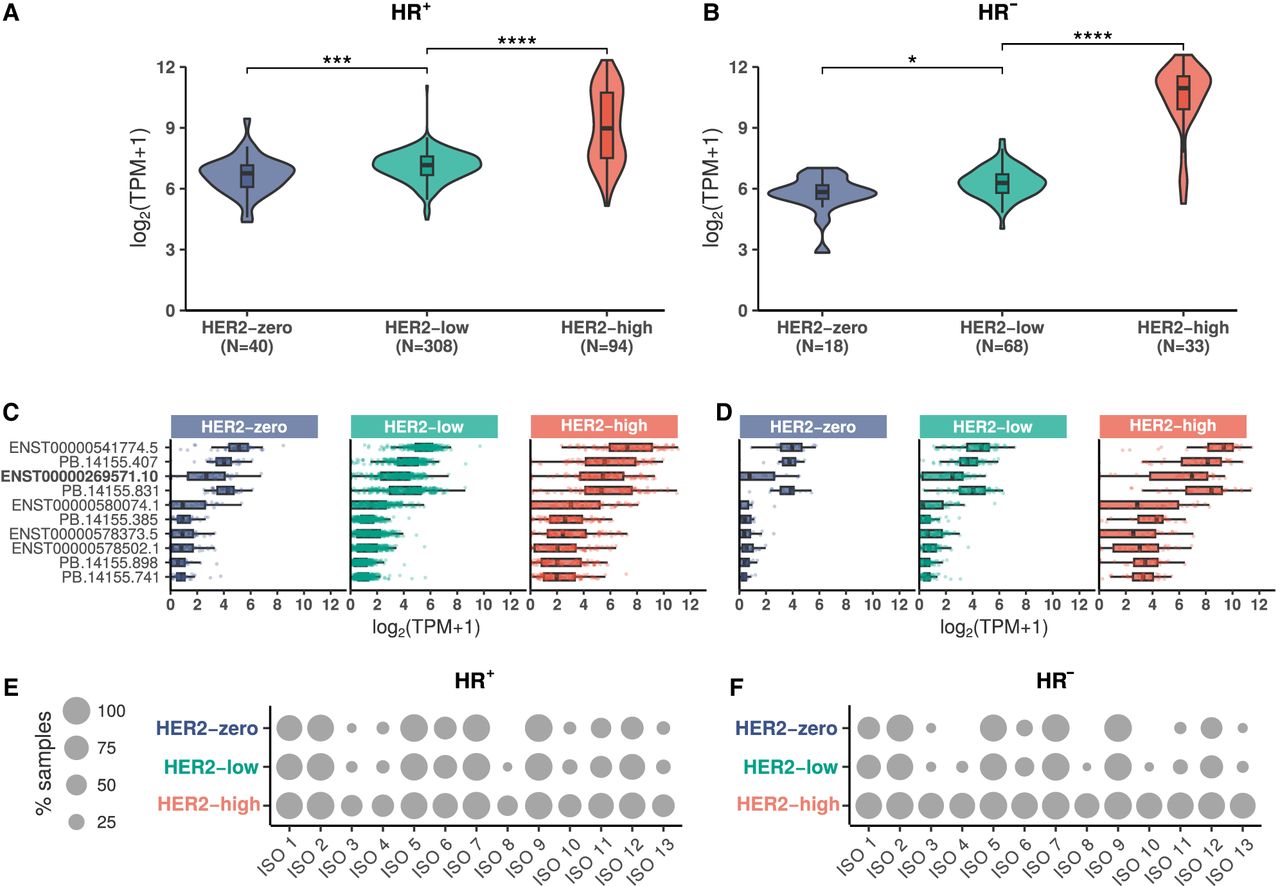
Expression profiles of HER2 gene and splicing isoforms in breast cancer samples classified by immunohistochemistry status of HER2 and hormone receptor. (A,B) HER2 gene expression levels in HR+ (A) and HR− (B) breast cancer samples, stratified by HER2-high (red), HER2-low (green), and HER2-zero (blue) status. Mann–Whitney U test statistical significance: (*) P-value < 0.05, (***) P-value < 0.001, (****) P-value < 0.0001. (C,D) Expression profiles of the top 10 most-expressed HER2 isoforms in HR+ (C) and HR− (D) breast cancer samples, stratified by HER2 status. The canonical HER2 isoform is highlighted in bold. Expression levels are shown in log2(TPM + 1). (E,F) Dot plots showing the percentage of HR+ (E) and HR− (F) TCGA breast cancer samples expressing each HER2 isoform group (ISO 1–13), stratified by HER2 status: zero (blue), low (green), and high (red).


