
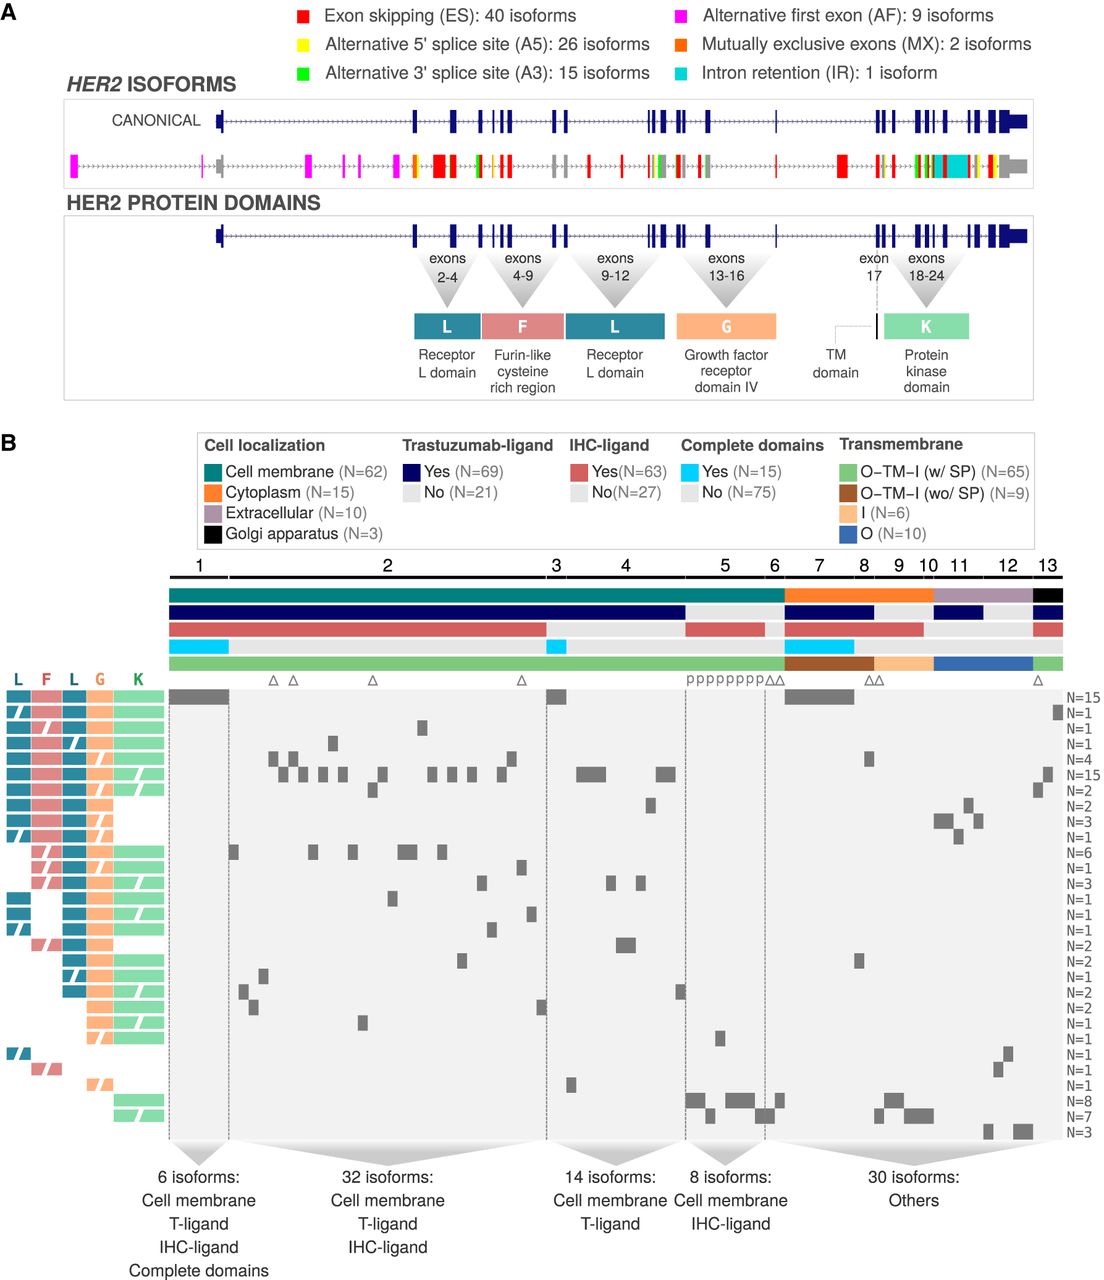
Comprehensive analysis of HER2 isoforms and their characteristics. (A) Structure of the HER2 canonical isoform and its splicing variants. The top panel displays the canonical HER2 isoform and alternative splicing events. The bottom panel illustrates the protein domains encoded by specific exons. (B) Structural and functional properties of HER2 isoform-encoded proteins. The top bars represent five characteristics of isoform-encoded proteins (e.g., cellular localizations, presence of trastuzumab and immunohistochemistry [IHC] binding regions, presence of complete protein domains and transmembrane topology: [O] outside, [TM] transmembrane region, [I] inside, [SP] signal peptide). The groups of isoform-encoded proteins (from 1 to 13), created based on those five characteristics, are discriminated above the top bars. Below the top bars, the isoforms p95 and Δ16 are represented by “P” and “Δ,” respectively. The heatmap shows the presence (dark gray squares) or absence (light gray background) of specific protein domain configurations (rows) for each isoform-encoded protein (columns). Colored and lettered protein domain configurations are represented on the left side of the heatmap ([L] receptor L domain, [F] furin-like domain, [G] growth factor receptor domain, [K] protein kinase domain), with incomplete domains represented by segmented labels. On the right side of the heatmap, the total number of isoform-encoded proteins with each specific protein domain configuration is presented. Vertical dashed lines help to visualize relevant groups of isoform-encoded proteins, which are described at the bottom of the heatmap.


