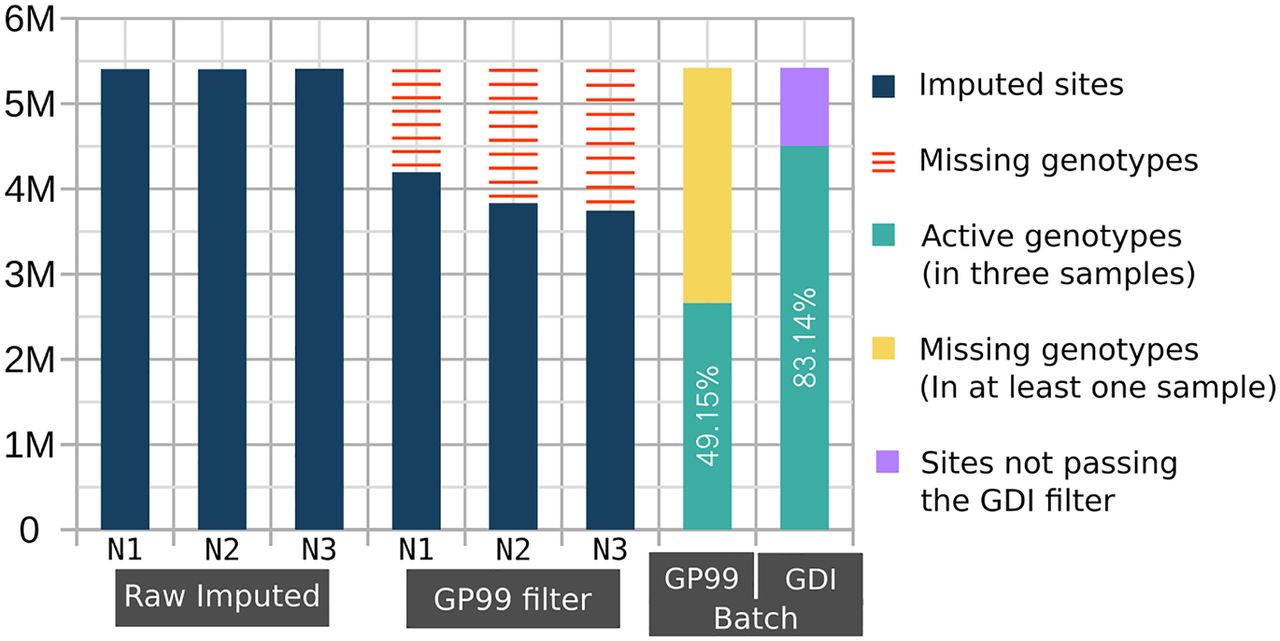
Cumulative missingness of filtered-out variants across multiple imputed genomes. The number of imputed common variants (MAFHRC > 0.05) is displayed in millions on the y-axis for each of the three imputed NIPS samples (N1, N2, and N3). The raw imputed data of each individual had 5.4 M variants. Applying GP < 0.99 filter (GP99 filter) on each individual separately results in a variable number of missing variants (red bars). The GP99 and GDI Batch bars to the right show the batch effect of cumulative missingness when applying the respective filters. The green bar shows the number of retained sites after removing variants with GP < 0.99 (yellow) in at least one sample or variant sites not passing the GDI filter (lilac).


