
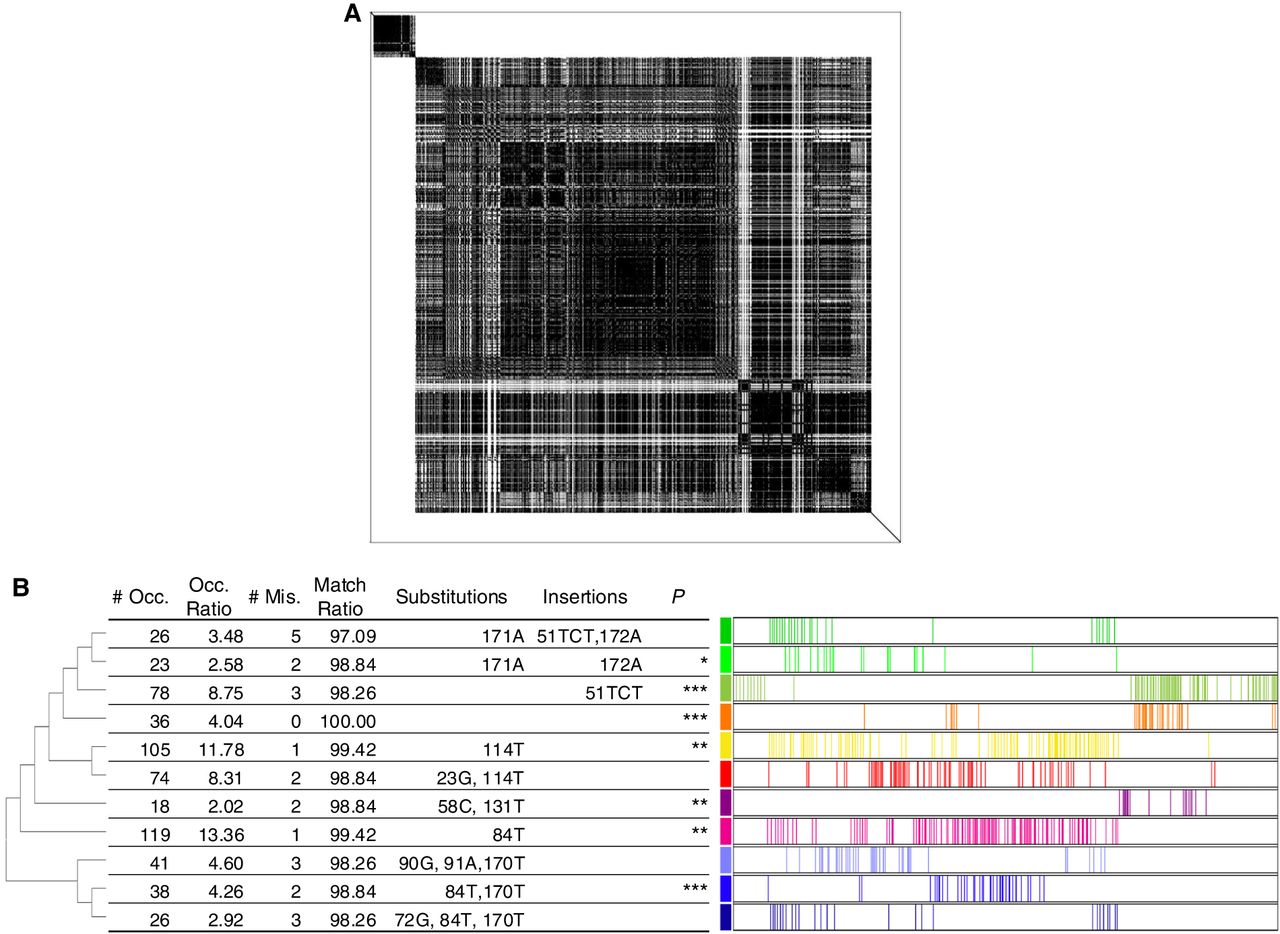
Structure of the pSX1 array. (A) Self-to-self dot plot of a region with the 153 kb pSX1 array in CHROMOSOME_X (441,085–594,508). Dots represent perfect matches of substrings of length 100 nt. (B) On the left side of the table, the phylogenetic tree shows the proximity of variants in terms of sequence similarity. On the right side of the table, the colored bars indicate the locations of the occurrences of each variant. Characteristics of 11 frequent variants of the reference pSX1 (172 nt; orange): the number of occurrences of each variant (# Occ.), the ratio of number of occurrences to total (Occ. ratio), number of mismatches with the reference pSX1 (# Mis.), percentage match with the reference (match ratio), positions of base substitutions (e.g., 171A means the base at position 171 is substituted with A), positions with insertion bases (e.g., 51TCT shows TCT is inserted at position 51), and the statistical significance codes for P-values. (***) P ≤ 0.1%, (**) P ≤ 1%, and (*) P ≤ 5% such that each variant occurs adjacent to each other preferentially according to the Wald–Wolfowitz runs test.


