
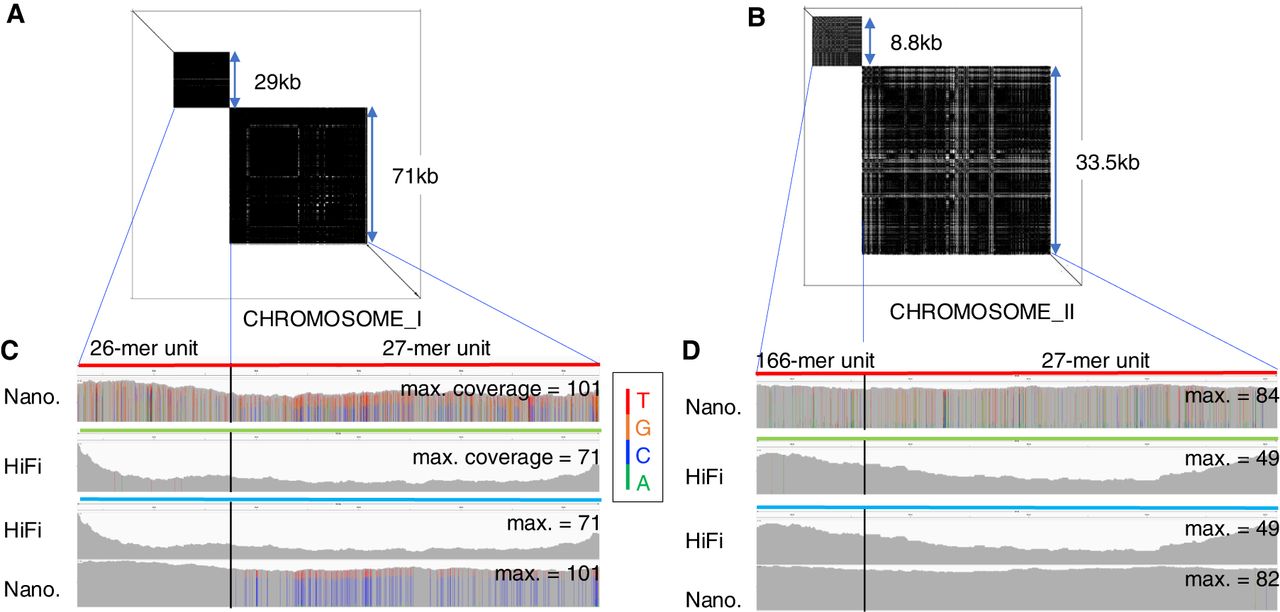
Polishing two complex tandem repeat regions in CHROMOSOME_I and CHROMOSOME_II. (A,B) Self-to-self dot plots of two Nanopore reads that span neighboring tandem repeats in CHROMOSOME_I (4,715,580–4,817,023; A) and CHROMOSOME_II (14,800,218–14,842,635; B). (C) The top row shows a spanning Nanopore read (colored red) and the coverage of other Nanopore reads mapped to the spanning read in CHROMOSOME_I. The bar for each base represents the distribution of aligned bases in the consensus. If one nucleotide accounts for >80%, the bar is colored gray; otherwise, the four nucleotides A, C, G, and T are green, blue, orange, and red, respectively. The second row shows coverage of HiFi reads mapped to the Nanopore consensus (light green). The third and fourth rows present coverages of HiFi reads and Nanopore reads to the HiFi consensus (light blue). Bars in the third row are gray, showing the consistency of HiFi reads with the HiFi consensus. The fourth row shows that there are many bars with C's (blue) as the majority and T's (red) as the minority, but the base in the consensus of all bars is C. (D) Read coverage of a spanning Nanopore read, Nanopore consensus, and HiFi consensus for complex tandem repeat regions in CHROMOSOME_II.


