
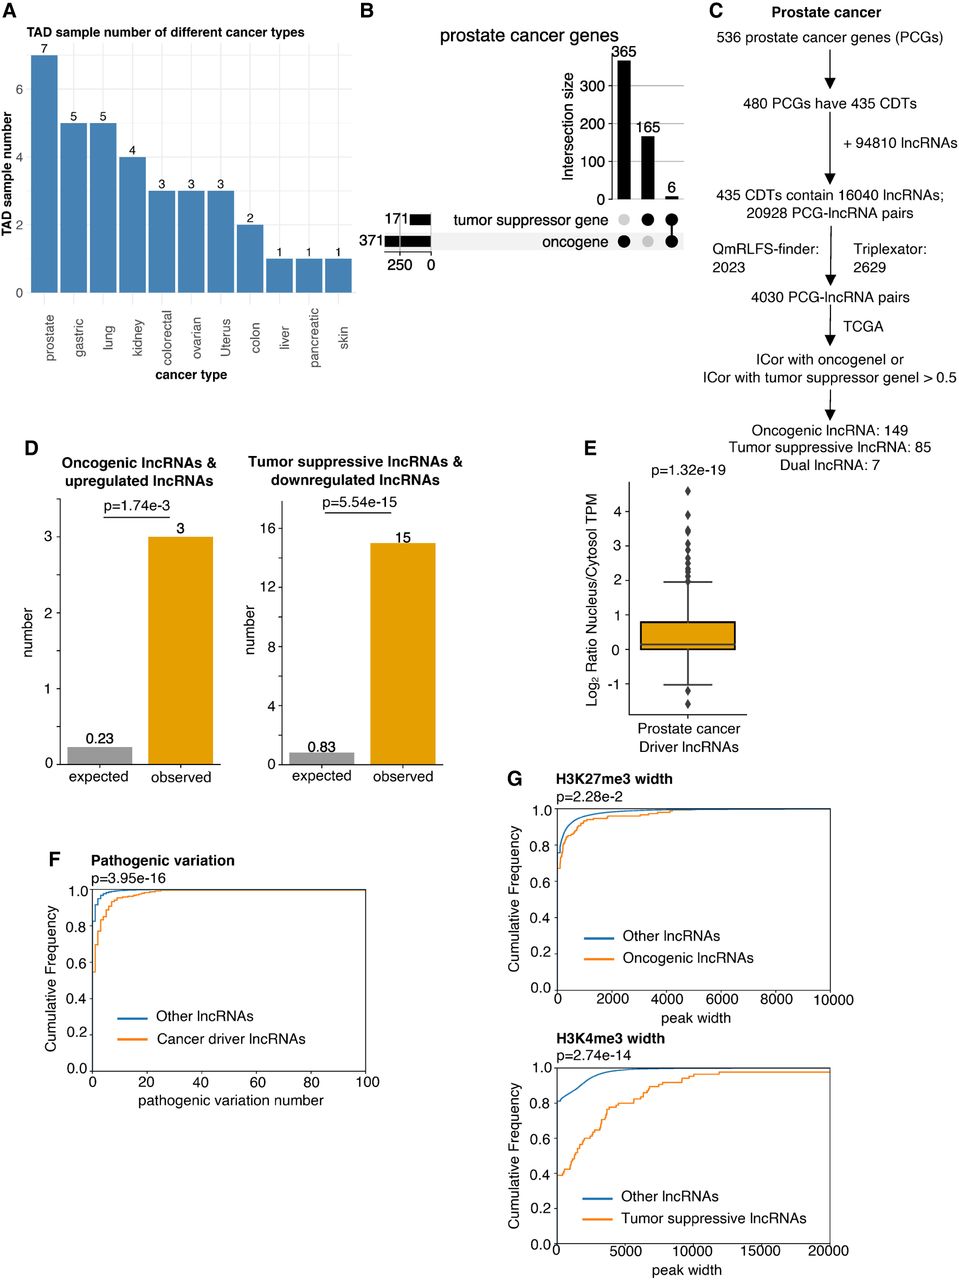
Discovery of potential cancer driver lncRNAs in prostate cancer and validation of their cancer characteristics using genomics and epigenomics data. (A) Bar plot to show the statistics of sample numbers about TAD data in individual cancers. (B) Upset plot to show the statistics of tumor suppressor genes and oncogenes in prostate cancer. (C) The flowchart of identifying potential cancer driver lncRNAs in prostate cancer. (D) Bar plot to show the enrichment of the putative oncogenic lncRNAs in upregulated lncRNAs in prostate cancer and putative tumor-suppressive lncRNAs in downregulated lncRNAs in prostate cancer. P-values are determined by one-tailed Fisher's exact test. (E) Box plot showing subcellular location tendency of the driver lncRNA candidates about prostate cancer. The P-value is determined by one-tailed t-test. (F) Empirical cumulative distribution plot to show the difference of pathogenic variations between putative cancer driver lncRNAs and the rest of other lncRNAs. P-value is determined by one-tailed Wilcoxon test. (G) Empirical cumulative distribution plot to show the difference of H3K27me3 width between oncogenic lncRNA candidates and the rest of other lncRNAs, and H3K4me3 width between tumor-suppressive lncRNA candidates and the rest of other lncRNAs. P-values are determined by one-tailed Wilcoxon test.


