
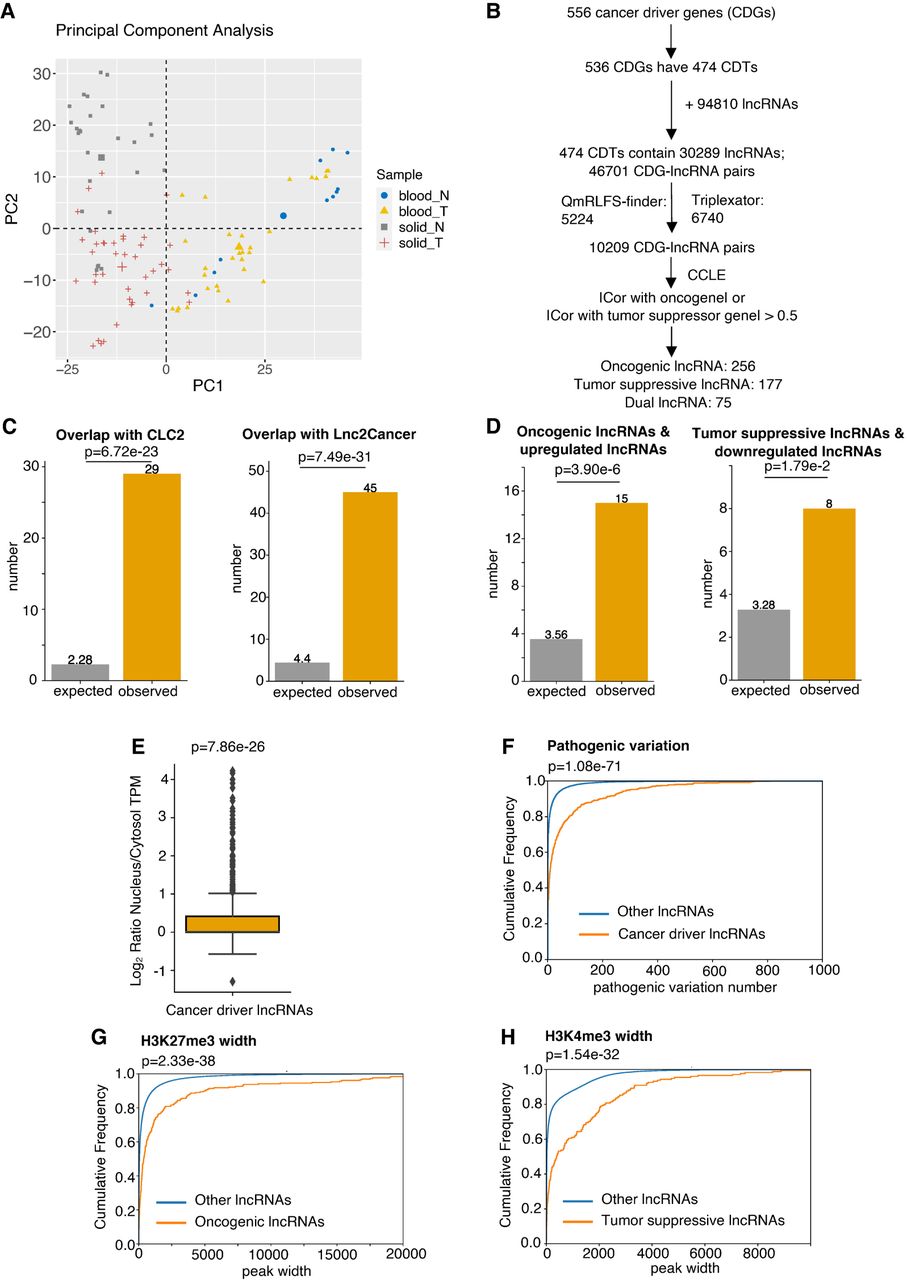
Discovery of potential pan-cancer driver lncRNAs using CADTAD and validation of their cancer-related characteristics using genomics and epigenomics data. (A) PCA plot to show the difference of TADs among normal blood samples, blood cancers, normal solid samples, and solid tumors. The blue dots represent normal blood samples. The yellow triangles represent blood cancers. The gray rectangles represent normal solid samples. The red crosses represent solid tumors. (B) The flowchart of identifying potential pan-cancer driver lncRNAs by CADTAD. (C) Bar plot to show the enrichment of pan-cancer driver lncRNA candidates in CLC2 and Lnc2Cancer data sets. P- values are determined by one-tailed Fisher's exact test. (D) Bar plot to show the enrichment of the potential oncogenic lncRNAs in upregulated lncRNAs in cancer, and potential tumor-suppressive lncRNAs in downregulated lncRNAs in cancer. P-values are determined by one-tailed Fisher's exact test. (E) Box plot showing the subcellular location tendency of pan-cancer driver lncRNA candidates. P-value is determined by one-tailed t-test. (F) Empirical cumulative distribution plot to show the difference of pathogenic variations between putative driver lncRNAs and the rest of other lncRNAs. P-value is determined by one-tailed Wilcoxon test. (G) Empirical cumulative distribution plot to show the difference of H3K27me3 width between oncogenic lncRNA candidates and the rest other lncRNAs. P-value is determined by one-tailed Wilcoxon test. (H) Empirical cumulative distribution plot to show the difference of H3K4me3 width between tumor-suppressive lncRNA candidates and the rest other lncRNAs. P-value is determined by one-tailed Wilcoxon test.


