
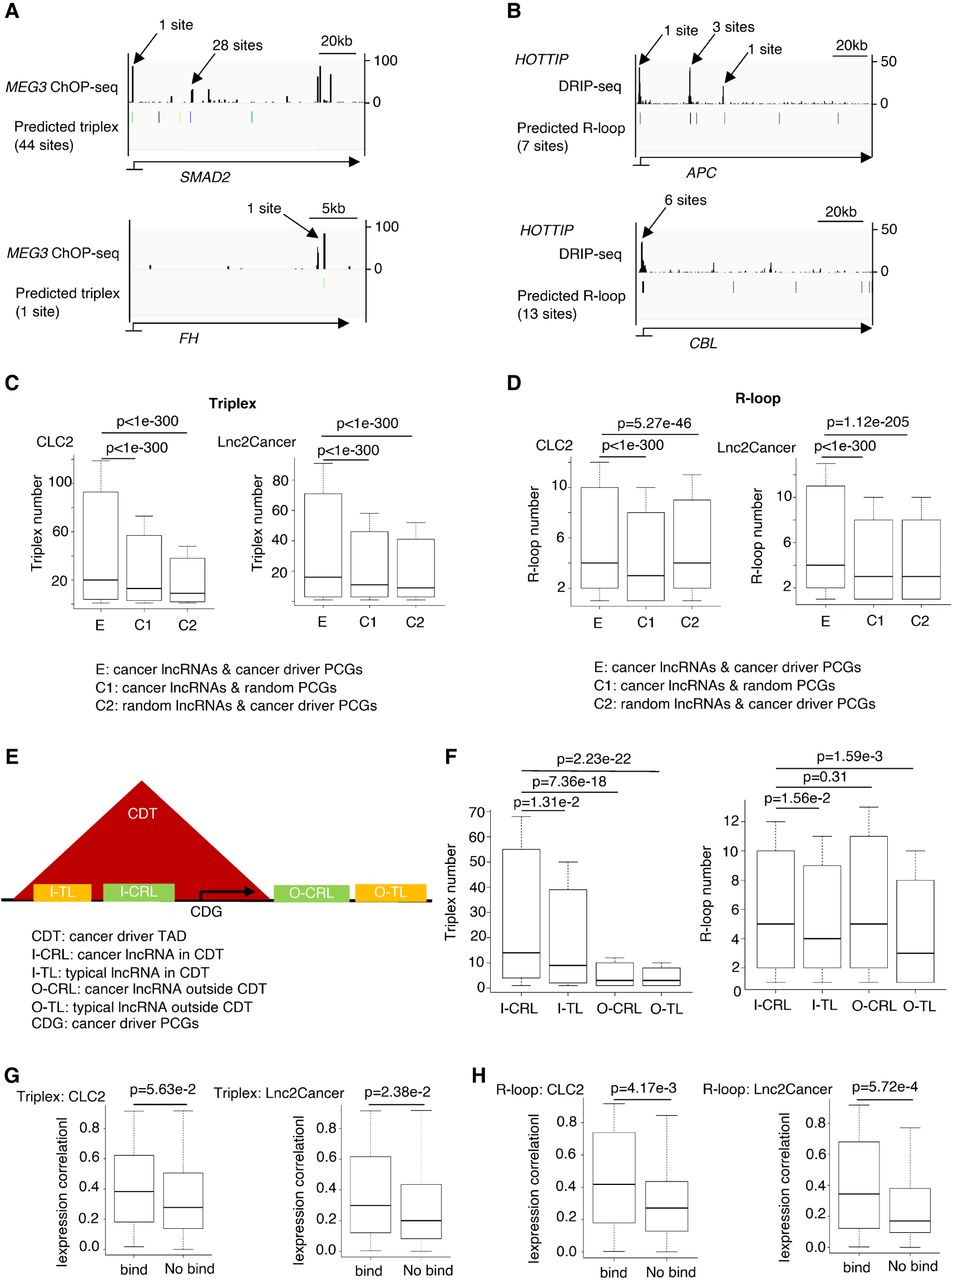
Cancer lncRNAs have a higher binding degree with cancer driver PCGs in the same TAD. (A) lncRNA MEG3 ChOP-seq signal and predicted triplex binding sites. (B) R-loop DRIP-seq signal and predicted R-loop formation sites of lncRNA HOTTIP. (C) Box plot to show the difference of triplex number between the experimental pair and two control pairs. P-values are determined by one-tailed Wilcoxon test. (D) Box plot to show the difference of R-loop number between the experimental pair and two control pairs. P-values are determined by one-tailed Wilcoxon test. (E) Cartoon pattern to show the definition of the four lncRNA types. (F) Box plot to show the difference of triplex and R-loop number among I-CRL, I-TL, O-CRL, and O-TL. I-CRL: cancer lncRNAs in CDT. I-TL: typical lncRNAs in CDT. O-CRL: cancer lncRNAs outside CDT. O-TL: typical lncRNAs outside CDT. P values determined by one-tailed Wilcoxon test. (G) Box plot to show the absolute Spearman's expression correlation between predicted binding pairs and no binding pairs in the same CDT about triplex. P-values are determined by one-tailed Wilcoxon test. (H) Box plot to show the absolute Spearman's expression correlation between predicted binding pairs and no binding pairs in the same CDT about R-loop. P-values are determined by one-tailed Wilcoxon test.


