
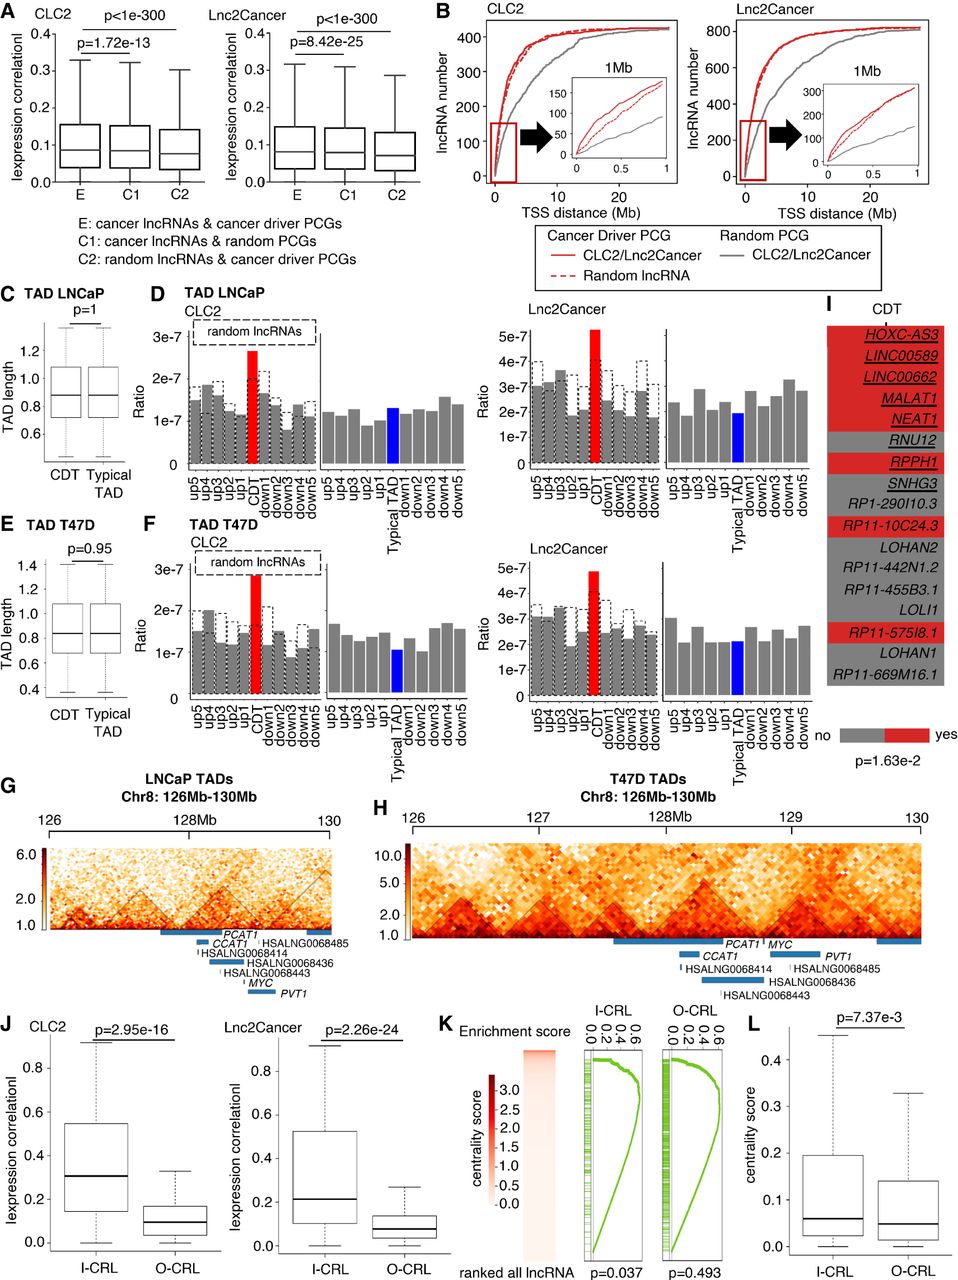
Cancer lncRNAs are more coexpressed with and located near cancer driver PCGs, especially in the same TAD. (A) Box plot to show the difference in absolute Spearman's correlation between the experimental pair and two control pairs. P-values are determined by one-tailed Wilcoxon test. (B) Line plot of the statistics of the lncRNA number in CLC2/Lnc2Cancer in regions whose step size is 40 kb extending from 40 kb to 28 Mb near the TSS of cancer driver/random PCGs. The red line indicates cancer driver PCGs, and the gray line indicates random PCGs. The solid line represents cancer lncRNA and the dashed line represents random lncRNA. (C) Box plot to indicate the TAD lengths of CDTs and typical TADs are almost the same in LNCaP. P-value is determined by two-tailed Wilcoxon test. (D) Bar plot to show the density of cancer/random lncRNAs in each TAD of LNCaP. The dashed line indicates random lncRNAs. The red bar represents the ratio of cancer lncRNAs in CDTs, and the blue bar represents the ratio of cancer lncRNAs in typical TADs. The gray bars represent flanking typical TADs. CDT: cancer driver TAD. (E) Box plot to indicate the TAD lengths of CDTs and typical TADs are almost the same in T47D. P-value is determined by two-tailed Wilcoxon test. (F) Bar plot to show the density of cancer/random lncRNAs in each TAD of T47D. The dashed line indicates random lncRNAs. The red bar represents the ratio of cancer lncRNAs in CDTs, and the blue bar represents the ratio of cancer lncRNAs in typical TADs. The gray bars represent flanking typical TADs. (G) The two-dimensional heat map shows the normalized Hi-C interaction frequencies in LNCaP. Black line box out the calculated TAD. Blue rectangles represent genes. (H) The two-dimensional heatmap shows the normalized Hi-C interaction frequencies in T47D. Black line boxes out the calculated TAD. Blue rectangles represent genes. (I) Heat map to show the CDT characteristic of the driver lncRNAs identified by ExInAtor2. The red box represents that lncRNA has this characteristic. The gray box represents that lncRNA does not have this characteristic. Underlined lncRNAs represent known driver lncRNAs. P-value is determined by one-tailed Fisher's exact test. (J) Box plot to show the difference in absolute Spearman's correlation between I-CRL pairs and O-CRL pairs. I-CRL: cancer lncRNAs in CDT. O-CRL: cancer lncRNAs outside CDT. P-values are determined by one-tailed Wilcoxon test. (K) GSEA analysis shows enrichment of the I-CRLs and O-CRLs in hub lncRNAs in a cancer-related lncRNA-mRNA network. (L) Box plot to indicate the difference in centrality score between I-CRLs and O-CRLs. P-value is determined by one-tailed Wilcoxon test.


