
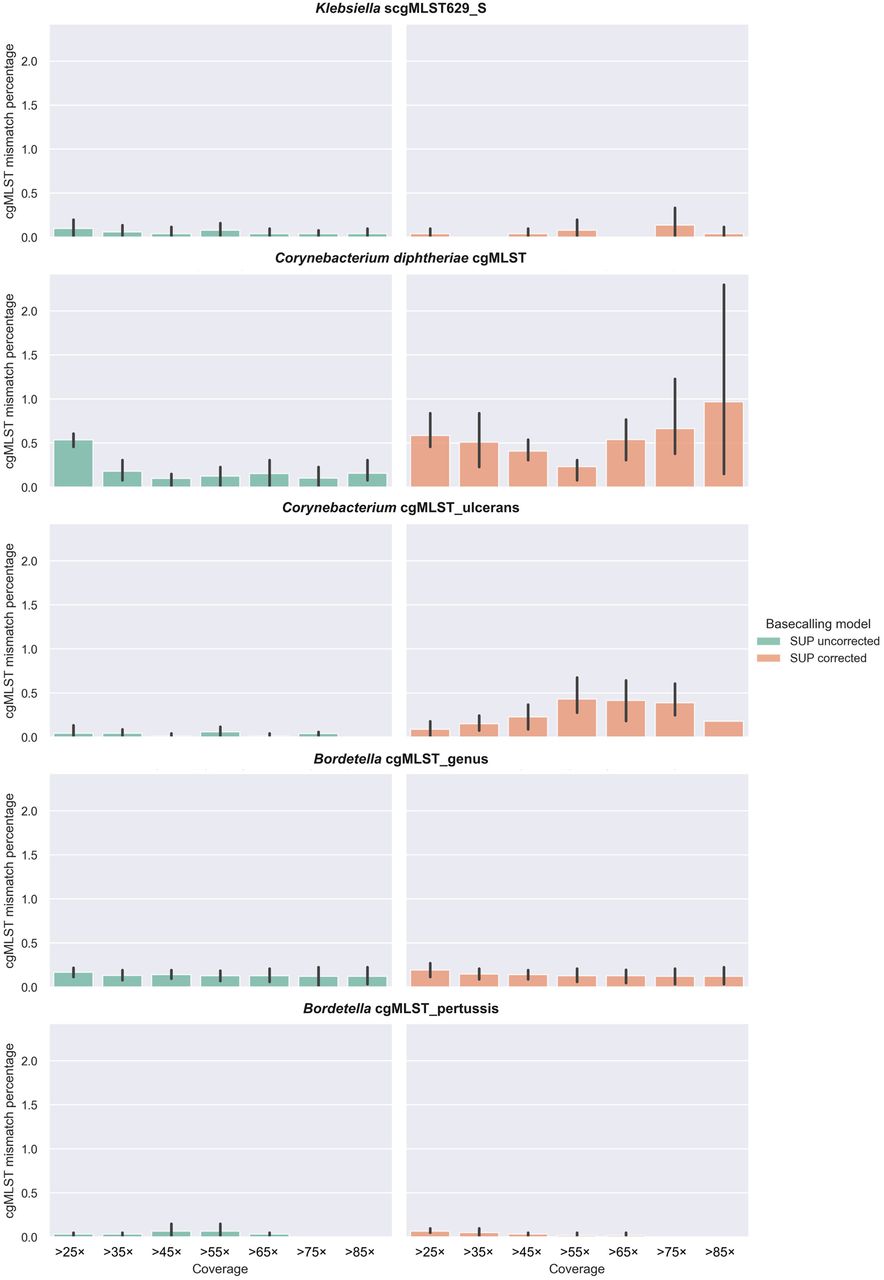
Figure 1.
Bar plots showing the percentages of cgMLST allelic mismatches between short-read assemblies generated with Illumina and long-read assemblies generated with Nanopore R10.4.1 sequencing from data basecalled with Dorado SUP v0.9.0. Mismatches are shown at different simulated depths of coverage, which were obtained with a cumulative subsampling strategy. Data on the left represent SUP assemblies without raw read correction (shown in green), whereas data on the right show mismatches for assemblies generated from HERRO-corrected reads (orange). Results for the C. rouxii isolate FRC0190T were excluded from this figure (see Results section).


