
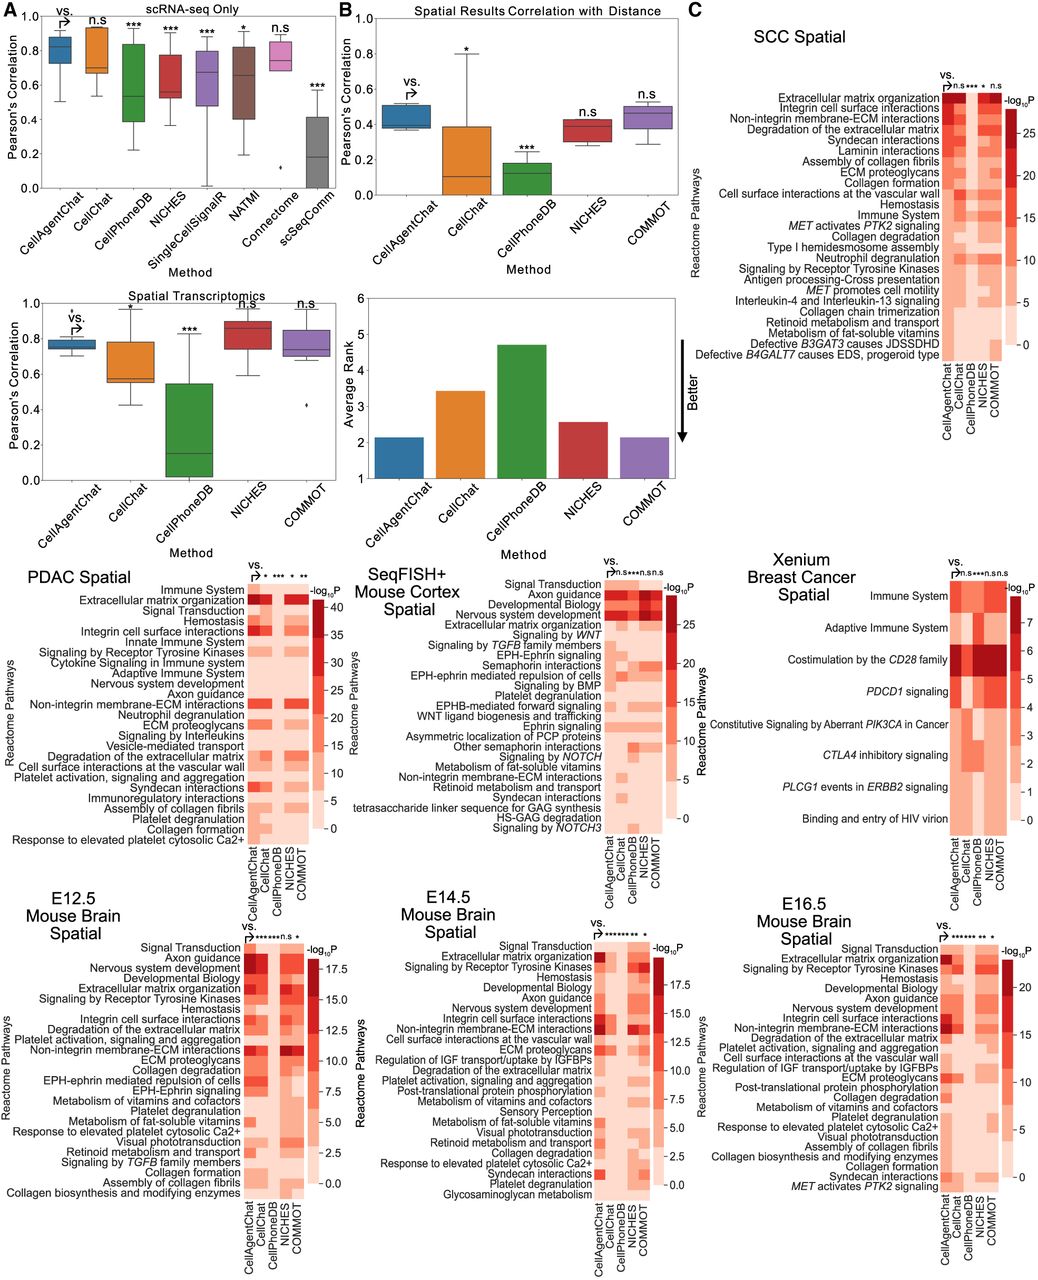
Benchmarking of CellAgentChat with existing state-of-the-art methods. (A) Box plot comparing the Pearson's correlation between inferred cell communication by individual methods and the ensemble of all methods, without (top) and with (bottom) spatial information across all data sets. P-values calculated using Wilcoxon one-sided test: (*) P < 0.05; (**) P < 0.01; (***) P < 0.001. (B) Box plot comparing the Pearson's correlation between the inferred cell communication for each method and the inverse cell-distance matrix (top), across data sets. P-values calculated using Wilcoxon one-sided test: (*) P < 0.05; (**) P < 0.01; (***) P < 0.001. Bottom plot in panel shows the average ranking (lower is better) of each method's correlation across data sets. (C) The Reactome pathway enrichment analysis, performed on ligands and receptors sourced from the top 100 LR pairs inferred by each method across various data sets using spatial transcriptomics data. P-values calculated using Wilcoxon one-sided test: (*) P < 0.05; (**) P < 0.01; (***) P < 0.001.


