
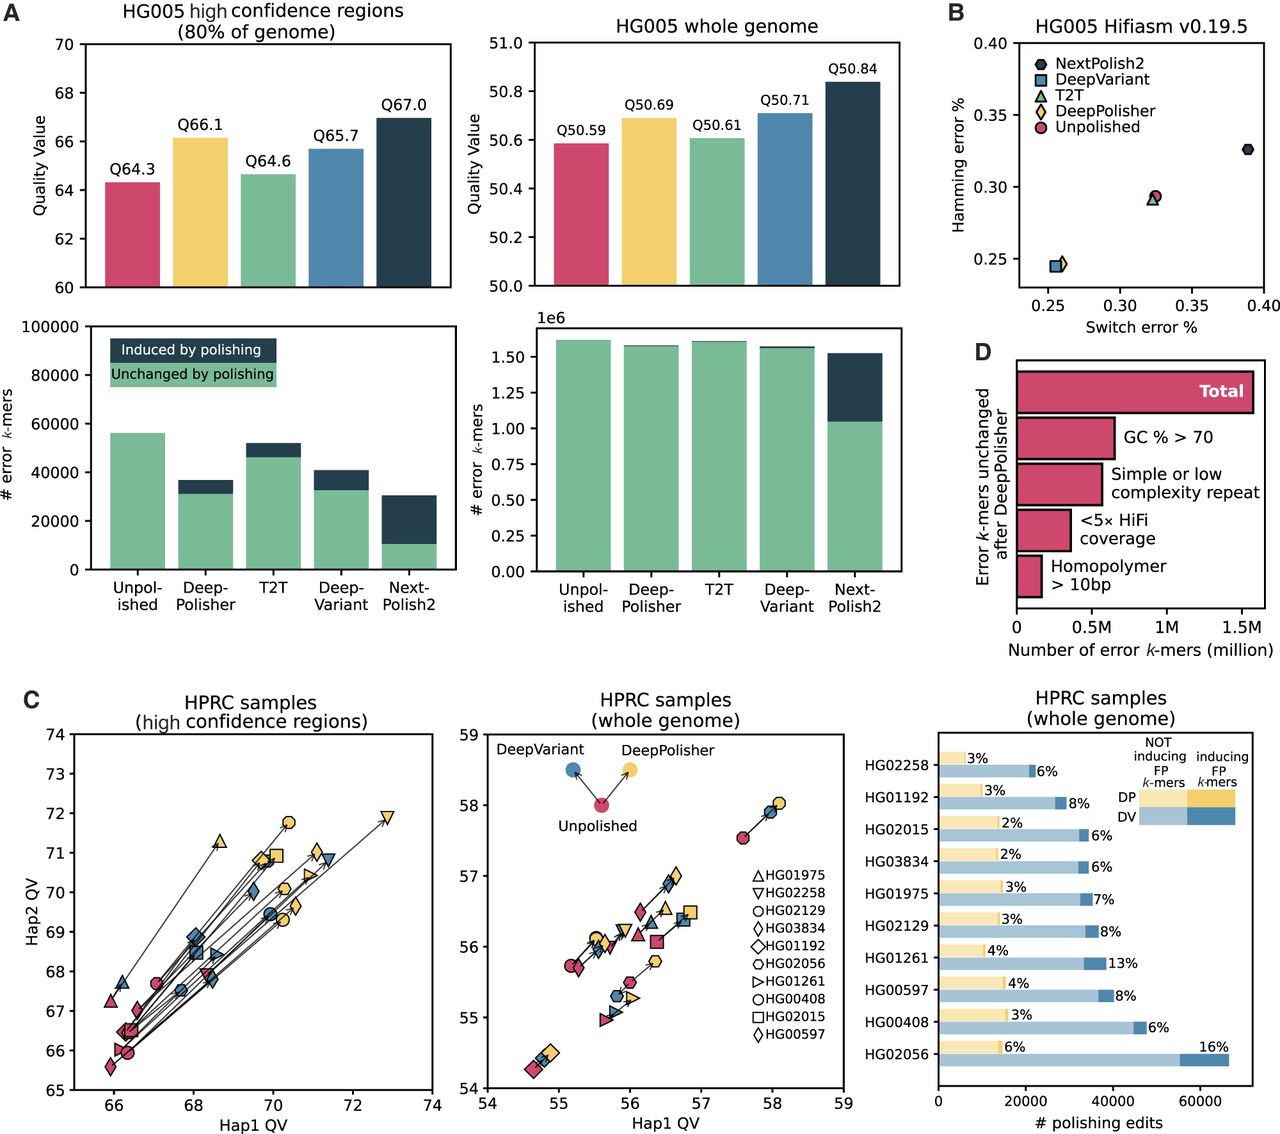
k-mer-based comparison of DeepPolisher and alternate polishing approaches for HG005. (A) Top panels display QV scores for each polishing method. Bottom panels depict total error k-mers, divided by error k-mers induced by polishing (dark blue) and error k-mers unchanged after polishing (green). Left panels show results for the GIAB high-confidence regions; right panels, whole genome. (B) Switch (x-axis) and hamming (y-axis) error rates for each polishing method. (C) Comparison of DeepVariant and DeepPolisher for eight HPRC samples. Left and middle panels show Hap1 (x-axis) and Hap2 (y-axis) QV for eight HPRC samples, with an arrow connecting the unpolished QV (pink) to the QV after polishing with DeepVariant (blue) and DeepPolisher (yellow). The left panel is within the GIAB high-confidence regions; middle panel, whole genome. The right panel shows the number of polishing edits from DeepPolisher (yellow) and DeepVariant (blue). Lighter shades indicate edits not inducing error (FP) k-mers; darker shades show edits that induce error k-mers. (D) Number of error k-mers unchanged by polishing with DeepPolisher falling into sequence annotation categories.


