
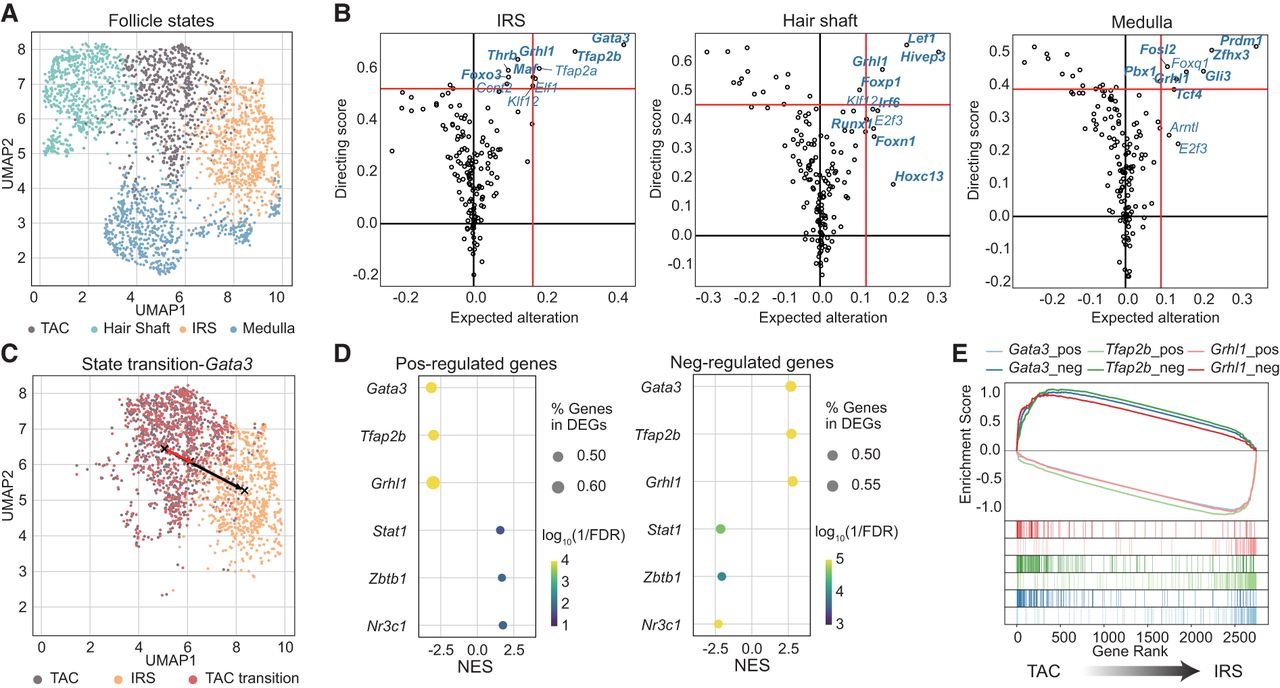
TFcomb identifies key TFs in mouse hair follicle development. TFs here refer to genes that encode the corresponding TFs. (A) UMAP visualization of down-sampled mouse hair follicle scRNA-seq data. (B) TFcomb TF identification plot on mouse hair developing lineages of IRS, hair shaft, and medulla. Red lines are the quantile thresholds to filter 10 TFs. DEGs are annotated in bold. (C) UMAP visualization of TAC transiting towards IRS with Gata3 changing the expected variation. (D) Dot plots of gene set enrichment analysis (GSEA) results, showing enrichment of the positively and negatively regulated target sets of TFcomb-identified TFs within DEGs between TAC and IRS. TFs that rank top three and bottom three are selected. (NES) normalized enrichment scores, (FDR) false-discovery rate. (E) GSEA plot of TF positively and negatively regulated gene sets within DEGs between TAC and IRS.


