
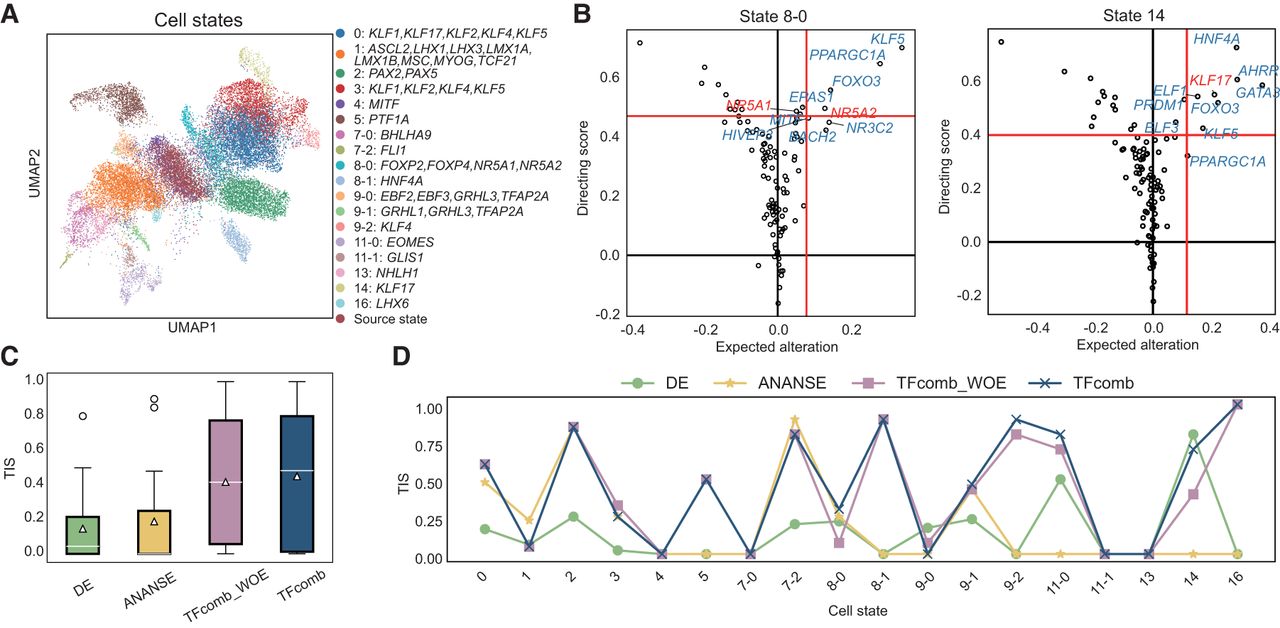
Figure 2.
TF identification benchmarking on a single-cell human embryonic stem cell (hESC) atlas. TFs here refer to genes that encode the corresponding transcription factors (TFs). (A) UMAP visualization of the single-cell hESC atlas. (B) TFcomb TF identification plot on target states 8-0 and 14. Red lines are the quantile thresholds to filter 10 TFs. Key TFs are annotated in red. (C) TF identification score (TIS) comparison across 18 target states. The box plots indicate the medians (c), means (triangles), and first and third quartiles (bounds of boxes). (D) Line plots of TIS comparison across 18 target states.


