
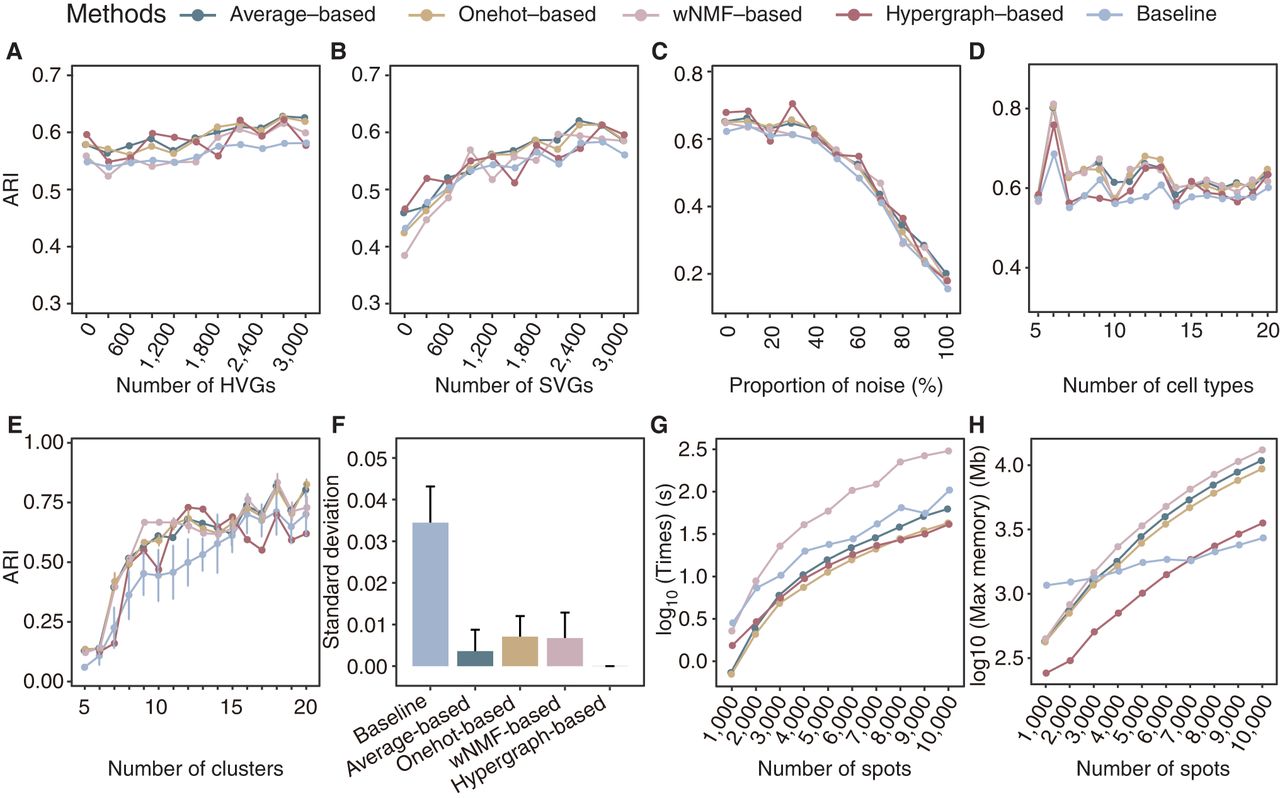
STCC performance on simulated data sets. (A,B) Line plots displaying the ARI for spatial domain detection on simulated data sets across different consensus strategies and baseline methods, with the y-axis showing how ARI varies as the number of added HVGs (A) and SVGs (B) increases. (ARI) Adjusted Rand index, (HVGs) highly variable genes, (SVGs) spatially variable genes. (C,D) Line plots showing the ARI by different consensus strategies and baseline method for spatial domain detection across simulated data sets change (y-axis) with the addition proportions of noise ratio (C) and number of cell types (D). (E) Line plot showing the ARI variation with the number of clusters. (F) The bar plots displaying the standard deviation of ARI from E for both the baseline algorithms and the four consensus strategies. (G,H) The runtimes (G) and maximum memory usage (H) of consensus strategies with varying spot numbers.


