
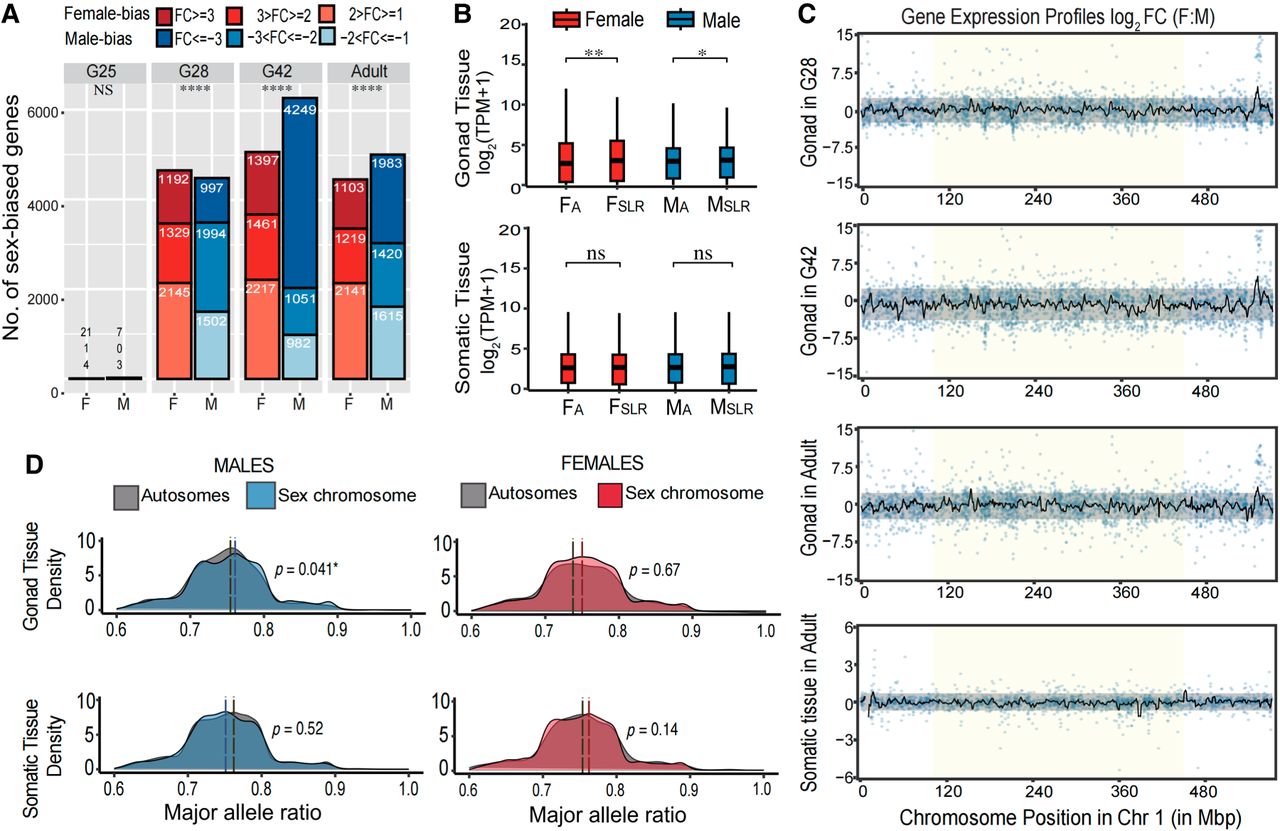
Patterns of gene expression and ASE. (A) Sex-biased gene expression in gonads across developmental stages in L. boringii. Sex-biased genes were classified into three categories by log2 FC (F:M), in which negative values indicate male-biased genes, and positive values indicate female-biased genes. (B) Comparison of gene expression between autosomes (A) and SLR in males (blue) and females (red). (C) Comparison of sex chromosome gene expression between the sexes across a three-development stage of gonad tissue and somatic tissue from adults. Sex chromosomes lack sex-biased expression beyond the expression range of autosomes (gray shading, the 95% confidence intervals based on bootstrapping), including the SLR (yellow shading). (D) Density plots show the distribution of the major allele frequency of autosomes (gray) and sex chromosomes (blue in male and red in female) genes in the two sexes. Vertical dotted lines indicate median values, and P-values are based on Wilcoxon rank-sum tests.


