
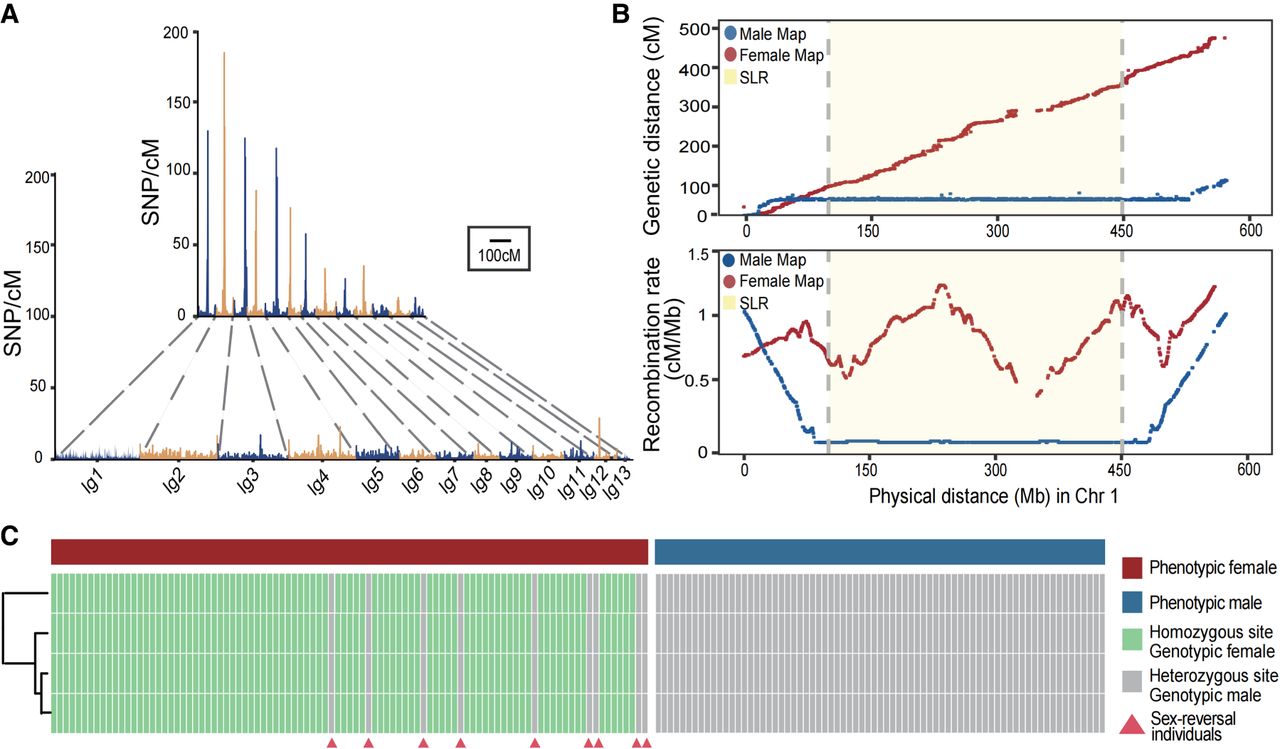
Genetic linkage map and recombination of L. boringii. (A) SNP density along the male (top) and female (bottom) recombination maps. (B) Concordance of physical SNP marker positions on reference genome with the genetic linkage map. The x-axis represents the physical position (Mb) of markers, the y-axis represents the genetic positions (cM) of markers on the linkage map (top) and the recombination rates (bottom); the light yellow region represents the position of the SLR identified from the GWAS result. (C) Sex-reversed individuals of L. boringii. The top row corresponds the phenotypic sex of L. boringii (blue indicates male individuals; red, female individuals), and other rows correspond to results of sex-linked markers: heterozygous in all genotypic males and homozygous in genotypic females. Individuals whose phenotypic and genotypic sex did not match were indicated as sex reversals (red triangles).


