
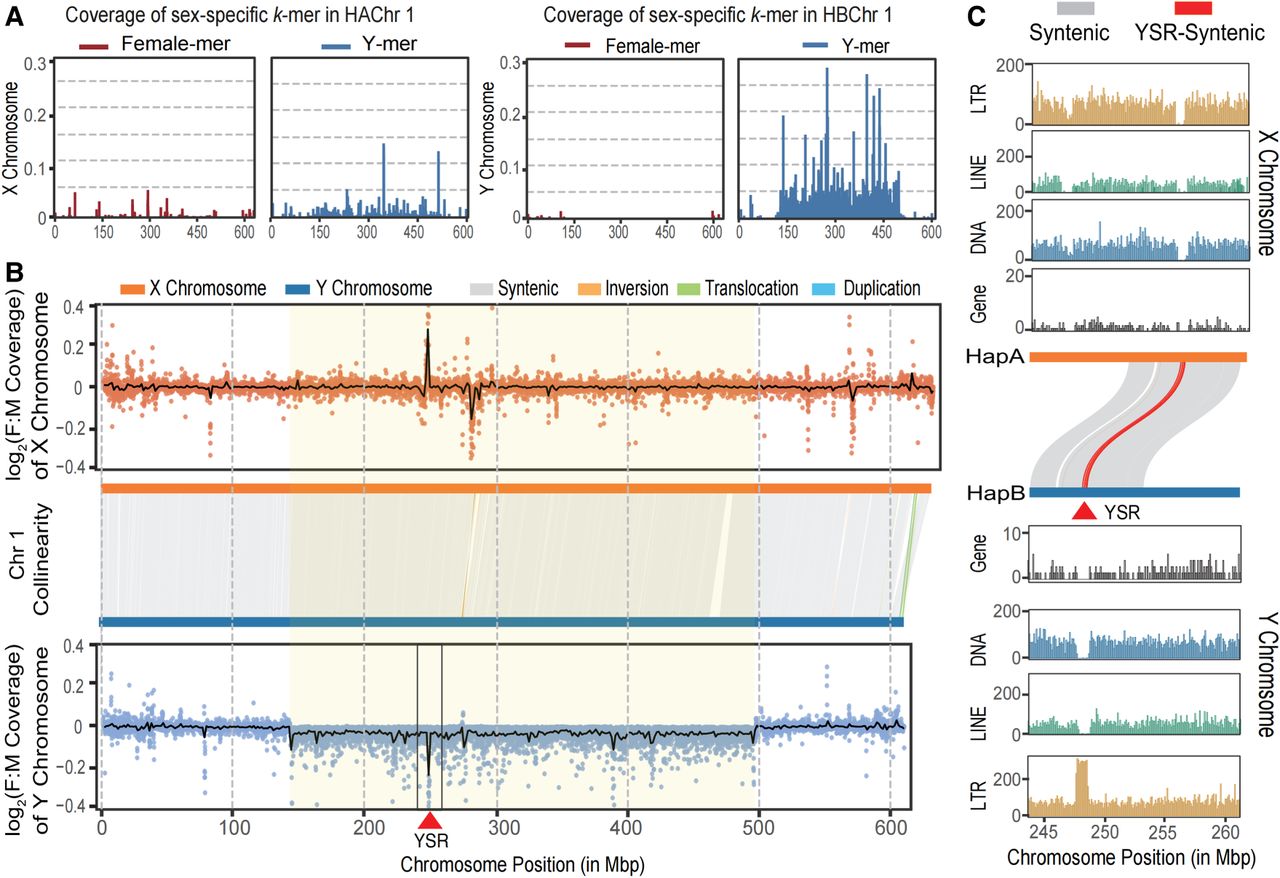
k-mer coverage, collinearity, and genomic characteristics of two haploid genomes. (A) Coverage of female-mers and Y-mers aligned to two phased Chr 1. The majority of Y-mers were aligned to HBChr 1, with only a small portion of female-mers aligned to either haplotype. (B) Collinearity, structural, and log2(F:M coverage) comparison of HAChr 1 genome (orange) and HBChr 1 genome (blue). The coverage in females was slightly lower than that in males in the central region of HBChr 1 (light yellow shadow), similar to SLR. (C) Gene count (dark) and repeat element distribution in haploid genomes (245–260 Mb). Yellow indicates LTR; green, LINE; blue, DNA. The YSR (red triangles) with synteny between HapA and HapB shown in red line.


