
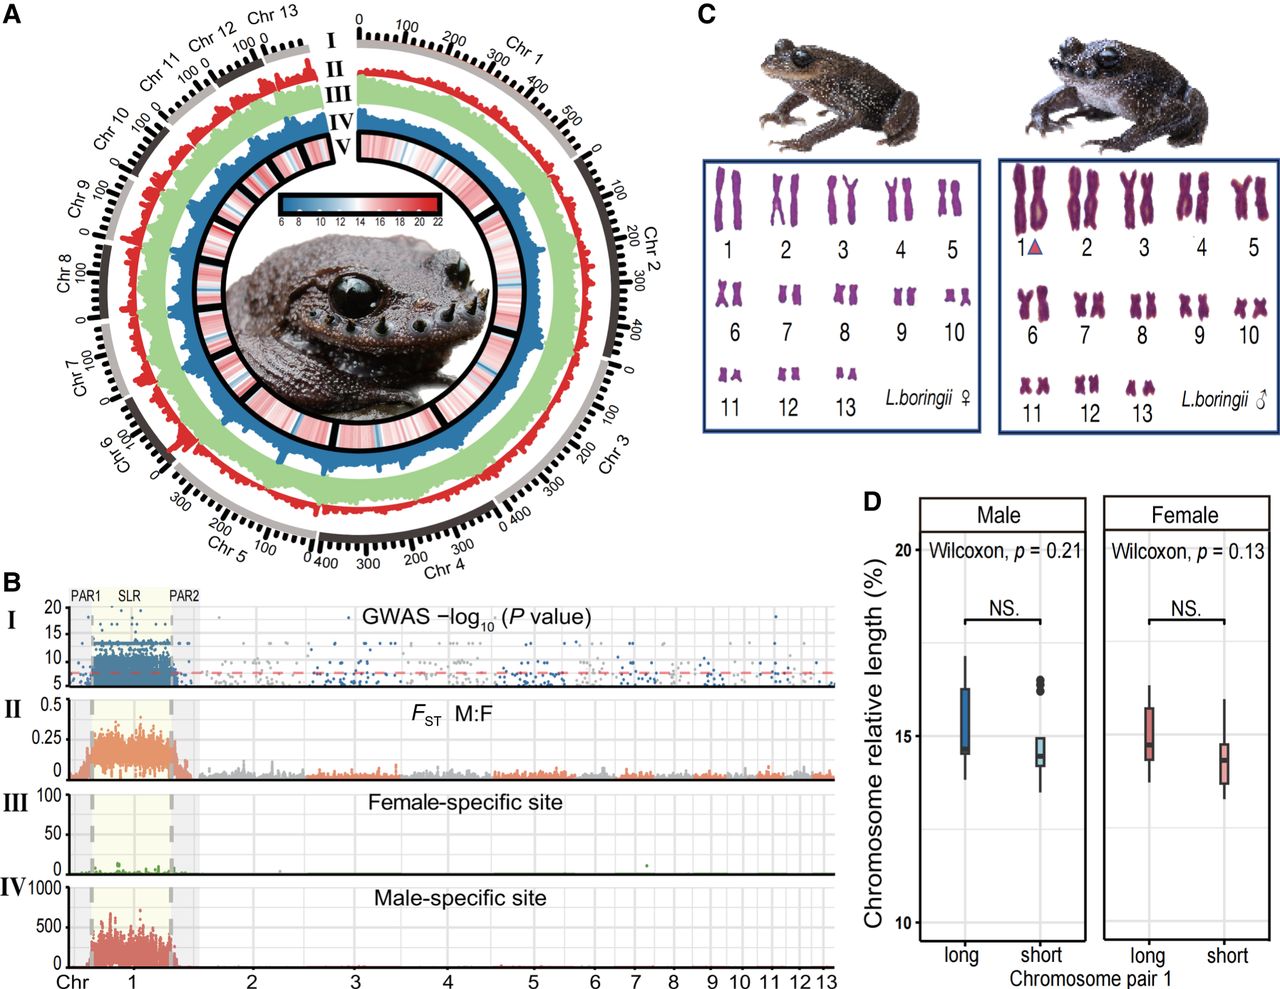
Landscapes of genome assembly (Lbor.v1) and sex chromosomes of L. boringii. (A) Various metrics calculated in 500 kb sliding windows across each chromosome. From outer to inner: (I) sizes of 13 pseudochromosomes; (II) gene density; (III) repeat sequence distribution; (IV) GC content (%); and (V) SNP density (numbers of SNP per window). (B) Sex-linked regions of L. boringii. From top to bottom: (I) –log10 P-values of all the significant sex-associated SNPs; (II) mean FST-value between the sexes; (III) the number of female-specific sites (heterozygous in females and homozygous in males); and (IV) the number of male-specific sites (heterozygous in males and homozygous in females). The red dashed line represents the threshold of GWAS (for statistical details, see Methods), light yellow and gray shadows represent the SLR and two PARs, respectively. (C) Karyotype of female (left and male (right) L. boringii. In the male karyotype (2N = 26), the XY pair (Chr 1) marked with a red triangle shows morphological homomorphy. (D) Box plots show the comparison of Chr 1 relative length in males (blue) and females (red); P-values were based on Wilcoxon rank-sum tests.


