
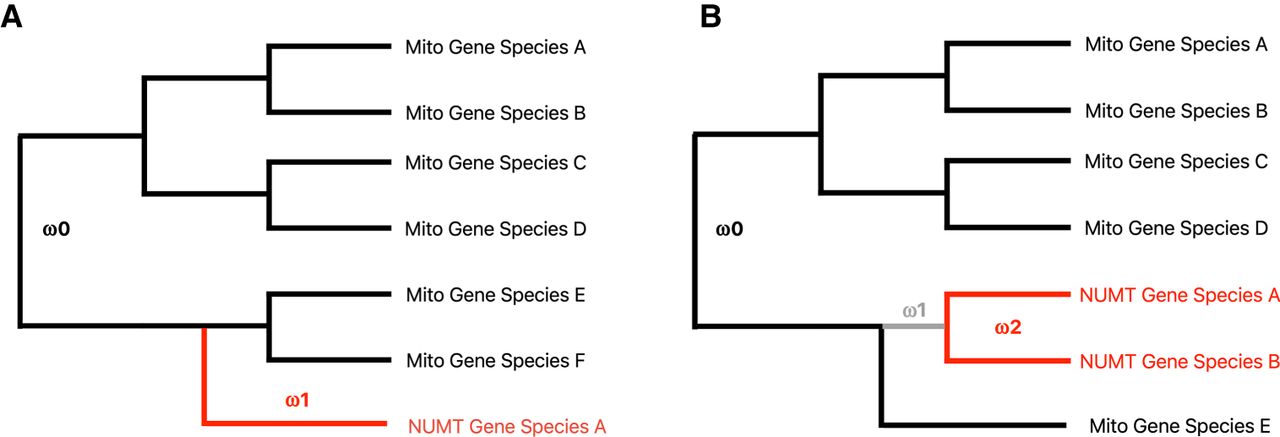
Figure 5.
Schematic illustration of the single gene and clustered genes codeml analysis. (A) Foreground branch in red (dN/dS = ω1) for a single NUMT gene; background branches (black, dN/dS = ω0) are for the respective mitochondrial genes of related species. (B) Foreground branch in red for NUMT gene clusters (dN/dS = ω2, here illustrated with a cluster size of two); background branches (black, dN/dS = ω0; gray, dN/dS = ω1) are for the respective mitochondrial genes of related species. Note that the gray branch is a separate background branch because it denotes the branch when the potential nuclear genomic integration took place.


