
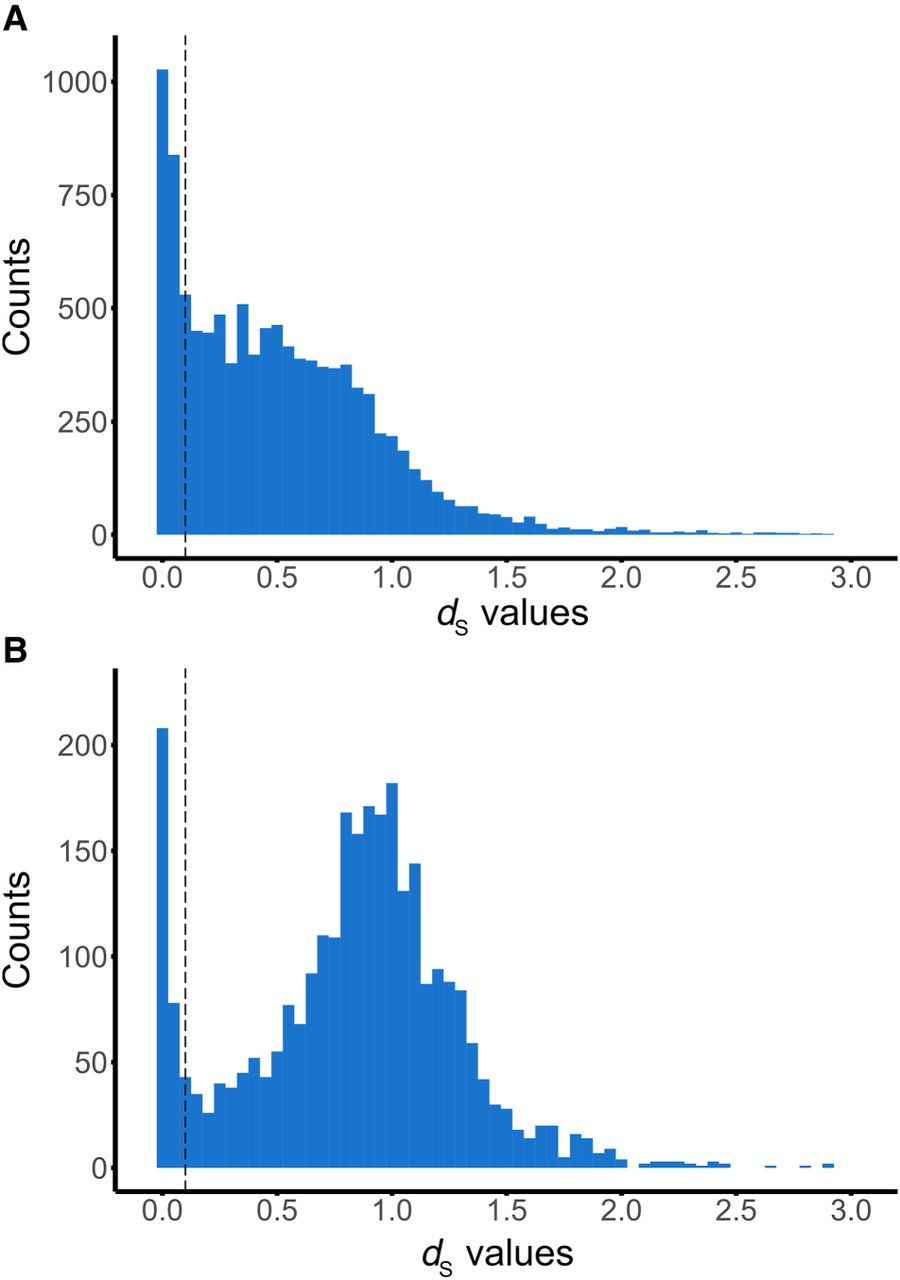
Figure 3.
Distribution of dS values of genes in cNUMTs. Shown are the distribution of dS values between genes in the NUMTs and the host species mitochondrial DNA. NUMTs that possess at least one gene with dS > 0.1 are considered dcNUMTs; dS = 0.1 is indicated by the dashed lines. Distributions are shown for mammals (A) and birds (B). Note that count data for dS values greater than three are not shown.


