
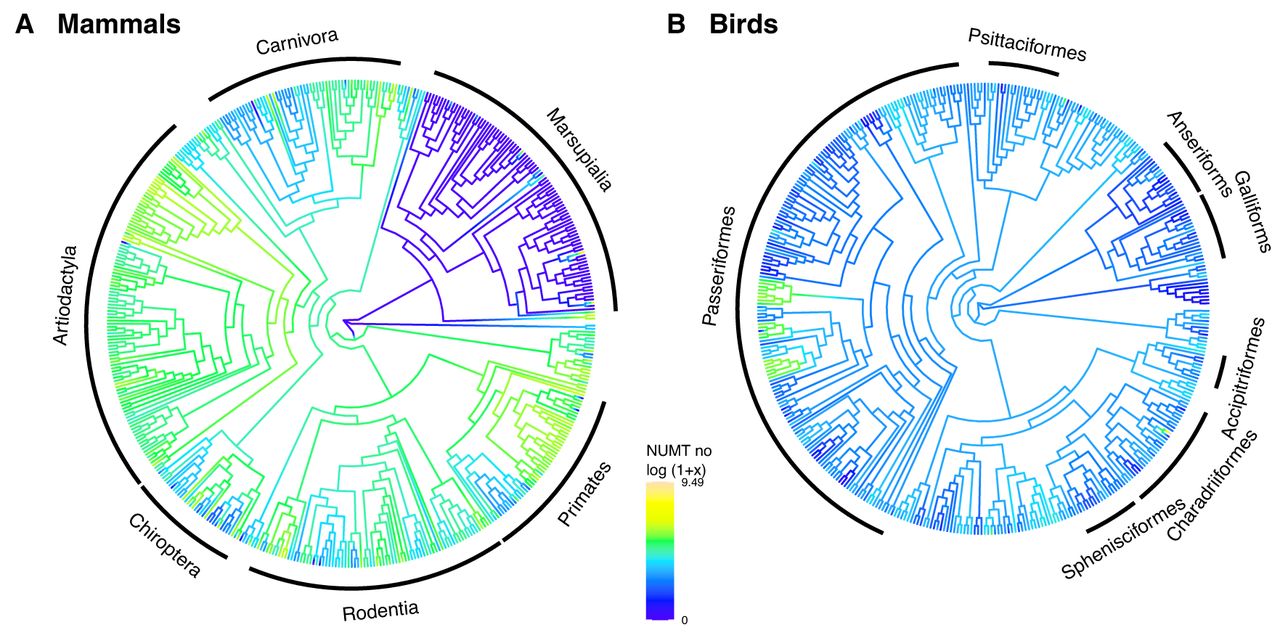
Figure 2.
Phylogenetic distribution of NUMT occurrences in mammals and birds. Shown are the species cladograms from TimeTree, with the colors representing the reconstructed number of NUMTs for mammals (A) and birds (B). Note that the colorized representation refers to the log-transformed (i.e., log(1 + x)) NUMT number.


